| child_ID | CTX_month | CTX_district | SDC_age_in_months |
|---|---|---|---|
| 1 | 7 | Kaliua | 10 |
| 2 | 7 | Kaliua | 6 |
| 3 | 7 | Kaliua | 6 |
| 4 | 7 | Kaliua | 11 |
| 5 | 8 | Kaliua | 21 |
21 :orange_book: Malaria case study - Report #1
21.1 Introduction
21.1.1 Instructions
The data set used for this report is stored in dataset2.dta or dataset2.xlsx or dataset2.csv.
- Derive new variables to data frame
df - Describe and critically discuss the distribution of consultations by facilities depending on their characteristics (urban vs. rural, health centre vs. dispensary, district)
- Describe and critically discuss the demographics, clinical presentation and clinical history of patients.
- Describe and critically discuss the clinical assessments (fever assessment, malaria test) conducted during the consultation.
21.1.2 Codebook
21.1.2.1 Numerical variables
| Variable |
|---|
| SDC_age_in_months |
| CLIN_fever_onset |
| MEAS_temperature |
21.1.2.2 Categorical variables
| Variable | Coding |
|---|---|
| SDC_sex | 1: male 2: female 98: unknown |
| CLIN_fever | 0: no 1: yes 98: not sure |
| CLIN_cough | 0: no 1: yes 98: not sure |
| CLIN_diarrhoea | 0: no 1: yes 98: not sure |
| RX_preconsult_antibiotics | 0: no 1: yes |
| RX_preconsult_antimalarials | 0: no 1: yes |
| CTX_district | Kaliua Sengerema Tanga |
| CTX_area | urban rural |
| CTX_facility_type | dispensary health centre |
| TEST_malaria_result | 0: negative 1: positive 2: indeterminate 95: unreadable result 98: not sure |
| DX_malaria | 0: no 1: yes |
| DX_malaria_severe | 0: no 1: yes |
| RX_antimalarials | 0: no 1: yes |
| RX_artemether | 0: no 1: yes |
| RX_antibiotics | 0: no 1: yes |
| MGMT_referral_src_caregiver | |
| MGMT_referral_src_registry |
21.1.3 Derive new variables
Add the following two new variables to data frame df
| Variable | Coding |
|---|---|
| SDC_age_category | <2 months 2-11 months 12-23 months 24-35 months 36-47 months 48-59 months |
| CLIN_fever_onset_category | <2 days 2-3 days 4-6 days ≥ 7 days |
21.1.4 Structure of the data
| Name | Piped data |
| Number of rows | 10308 |
| Number of columns | 40 |
| _______________________ | |
| Column type frequency: | |
| factor | 9 |
| numeric | 2 |
| ________________________ | |
| Group variables | None |
Variable type: factor
| skim_variable | n_missing | complete_rate | ordered | n_unique | top_counts |
|---|---|---|---|---|---|
| SDC_sex | 4 | 1 | FALSE | 2 | 1: 5229, 2: 5075 |
| CLIN_fever | 0 | 1 | FALSE | 3 | 1: 7225, 0: 3068, 98: 15 |
| CLIN_diarrhoea | 0 | 1 | FALSE | 3 | 0: 7982, 1: 2306, 98: 20 |
| CLIN_cough | 0 | 1 | FALSE | 3 | 1: 5635, 0: 4658, 98: 15 |
| RX_preconsult_antibiotics | 0 | 1 | FALSE | 2 | 0: 8573, 1: 1735 |
| RX_preconsult_antimalarials | 0 | 1 | FALSE | 2 | 0: 9866, 1: 442 |
| CTX_district | 0 | 1 | FALSE | 3 | Tan: 5176, Sen: 2703, Kal: 2429 |
| CTX_area | 0 | 1 | FALSE | 2 | urb: 6220, rur: 4088 |
| CTX_facility_type | 0 | 1 | FALSE | 2 | dis: 5599, hea: 4709 |
Variable type: numeric
| skim_variable | n_missing | complete_rate | mean | sd | p0 | p25 | p50 | p75 | p100 | hist |
|---|---|---|---|---|---|---|---|---|---|---|
| SDC_age_in_months | 0 | 1.0 | 18.75 | 14.90 | 0 | 7 | 15 | 27 | 59 | ▇▆▃▂▁ |
| CLIN_fever_onset | 3083 | 0.7 | 2.50 | 1.93 | 0 | 1 | 2 | 3 | 14 | ▇▅▁▁▁ |
| Name | Piped data |
| Number of rows | 10308 |
| Number of columns | 43 |
| _______________________ | |
| Column type frequency: | |
| factor | 12 |
| numeric | 1 |
| ________________________ | |
| Group variables | None |
Variable type: factor
| skim_variable | n_missing | complete_rate | ordered | n_unique | top_counts |
|---|---|---|---|---|---|
| TEST_malaria_done | 0 | 1.00 | FALSE | 2 | 1: 5763, 0: 4545 |
| TEST_malaria_type | 4550 | 0.56 | FALSE | 4 | 1: 5371, 2: 340, 98: 45, 95: 2 |
| TEST_malaria_result | 4550 | 0.56 | FALSE | 5 | 0: 4665, 1: 1032, 98: 57, 95: 3 |
| DX_severe | 0 | 1.00 | FALSE | 2 | 0: 10054, 1: 254 |
| DX_malaria | 0 | 1.00 | FALSE | 2 | 0: 8508, 1: 1800 |
| DX_malaria_severe | 0 | 1.00 | FALSE | 2 | 0: 10160, 1: 148 |
| RX_antimalarials | 0 | 1.00 | FALSE | 2 | 0: 9018, 1: 1290 |
| RX_antimalarial_parenteral | 0 | 1.00 | FALSE | 2 | 0: 10059, 1: 249 |
| RX_artemether | 0 | 1.00 | FALSE | 2 | 0: 10248, 1: 60 |
| RX_antibiotics | 0 | 1.00 | FALSE | 2 | 1: 5430, 0: 4878 |
| MGMT_referral_src_caregiver | 0 | 1.00 | FALSE | 4 | 0: 10122, 1: 164, 98: 13, 97: 9 |
| MGMT_referral_src_registry | 0 | 1.00 | FALSE | 2 | 0: 10194, 1: 114 |
Variable type: numeric
| skim_variable | n_missing | complete_rate | mean | sd | p0 | p25 | p50 | p75 | p100 | hist |
|---|---|---|---|---|---|---|---|---|---|---|
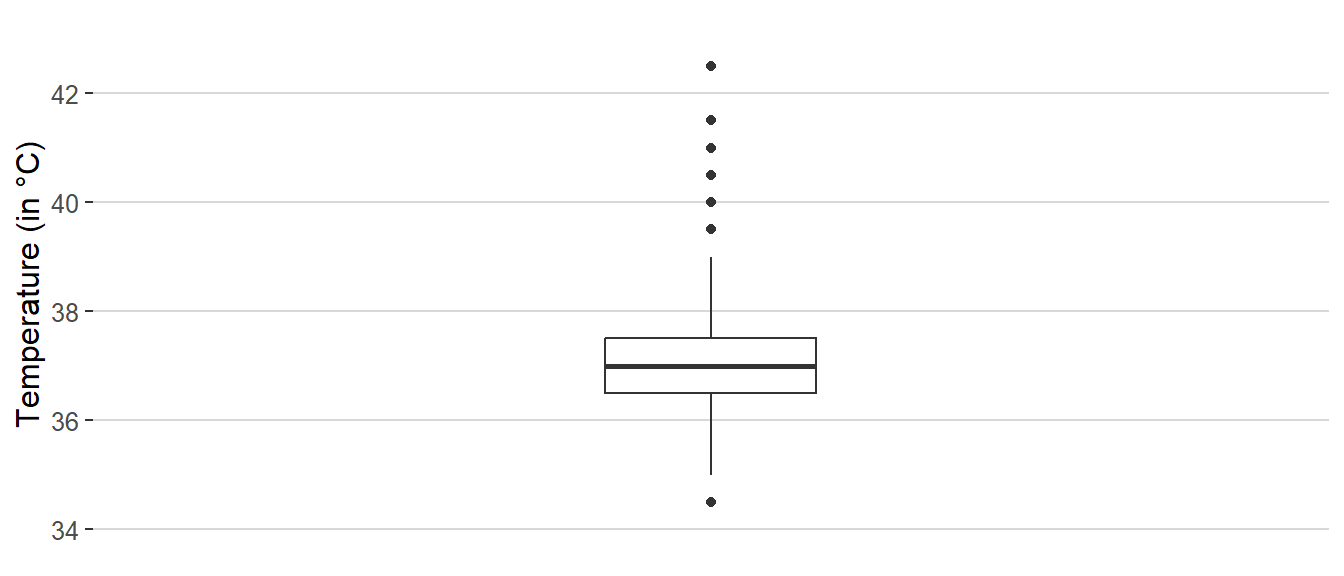
| MEAS_temperature | 9271 | 0.1 | 37.08 | 0.98 | 34.5 | 36.5 | 37 | 37.5 | 42.5 | ▃▇▃▁▁ |
21.2 Facility characteristics
Describe and critically discuss the distribution of consultations by facilities depending on their characteristics (urban vs. rural, health centre vs. dispensary, district)
| Characteristic | N = 10,3081 |
|---|---|
| CTX_facility_type | |
| dispensary | 5,599 (54%) |
| health center | 4,709 (46%) |
| CTX_area | |
| rural | 4,088 (40%) |
| urban | 6,220 (60%) |
| CTX_district | |
| Kaliua | 2,429 (24%) |
| Sengerema | 2,703 (26%) |
| Tanga | 5,176 (50%) |
| 1 n (%) | |
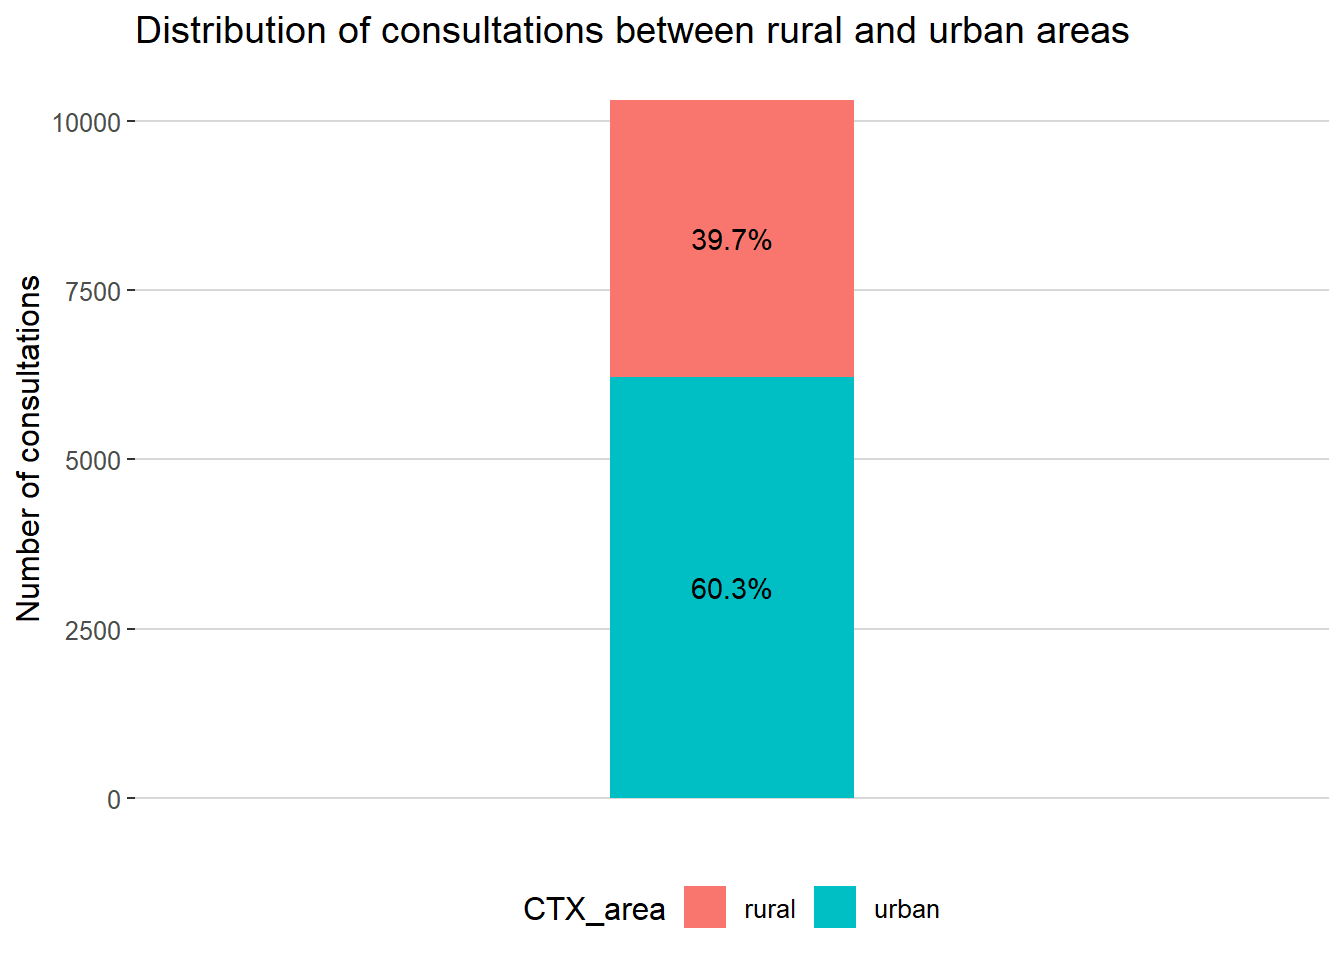
21.2.1 Urban / rural consultations
Describe the distribution of consultations in urban vs. rural facilities
| Area | Freq |
|---|---|
| rural | 0.3965852 |
| urban | 0.6034148 |

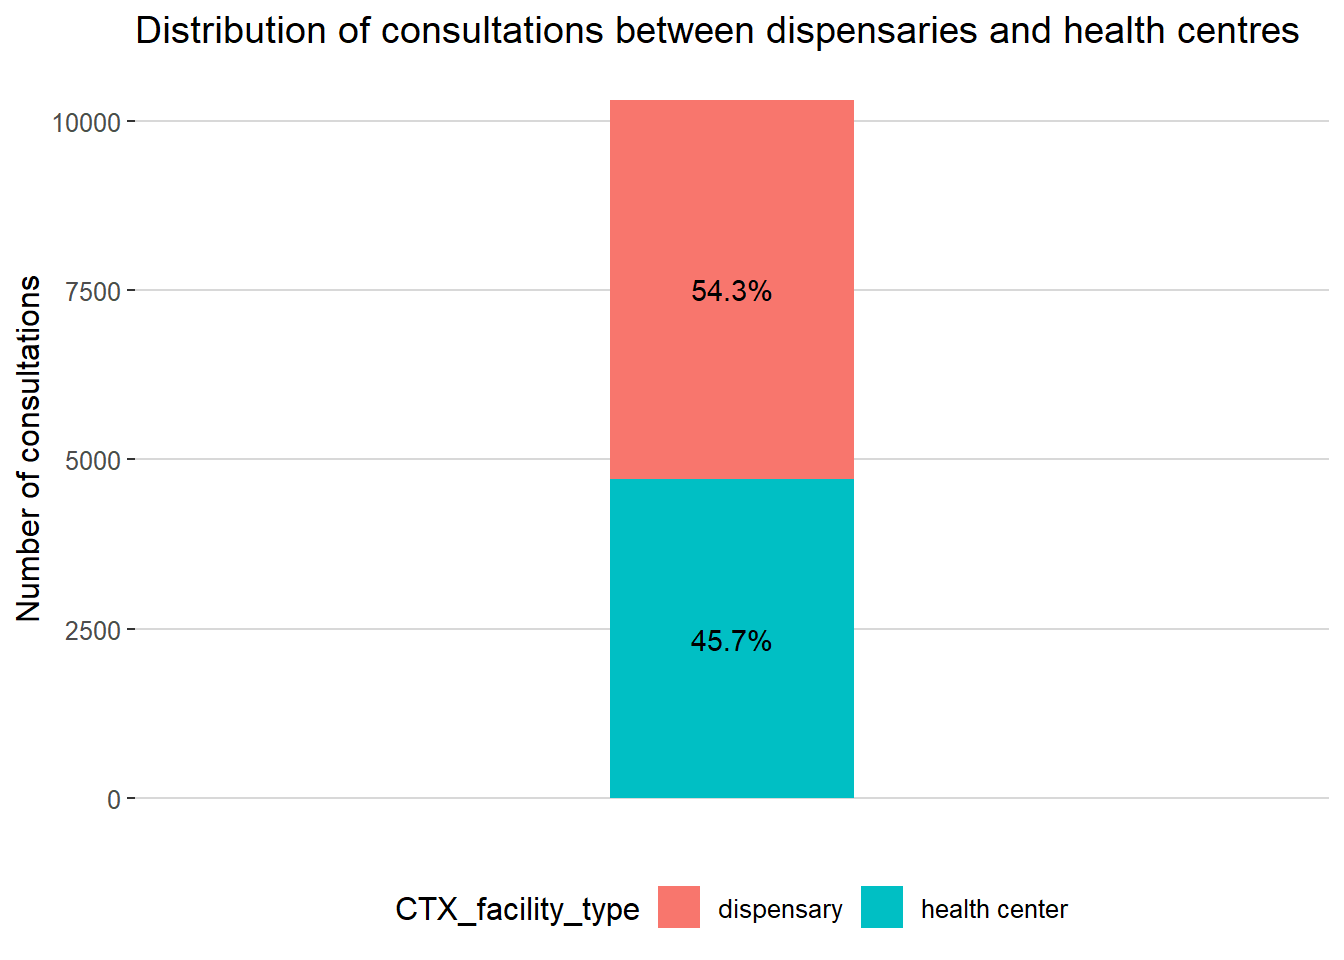
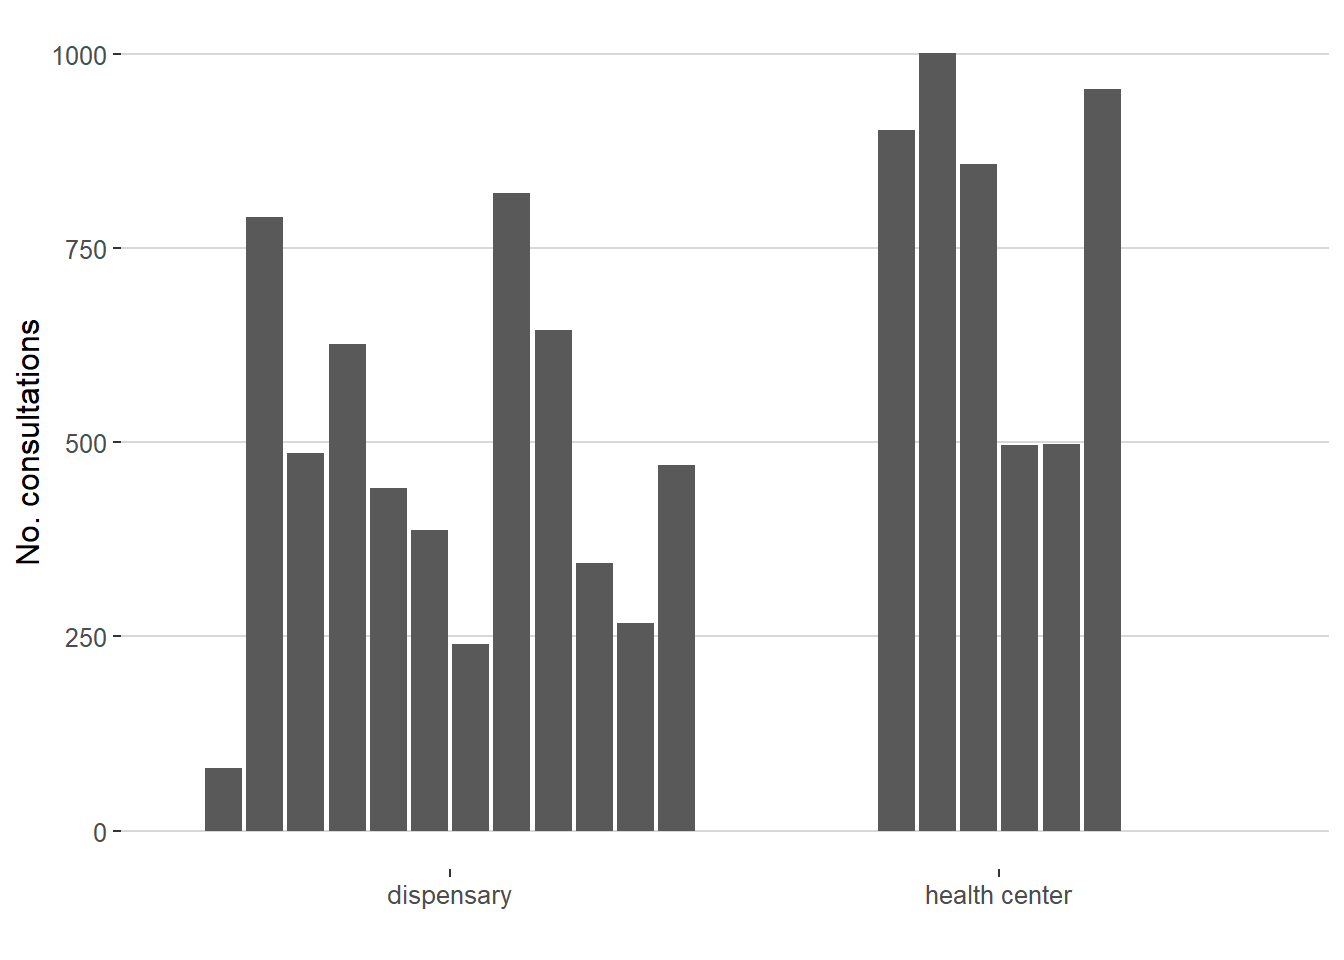
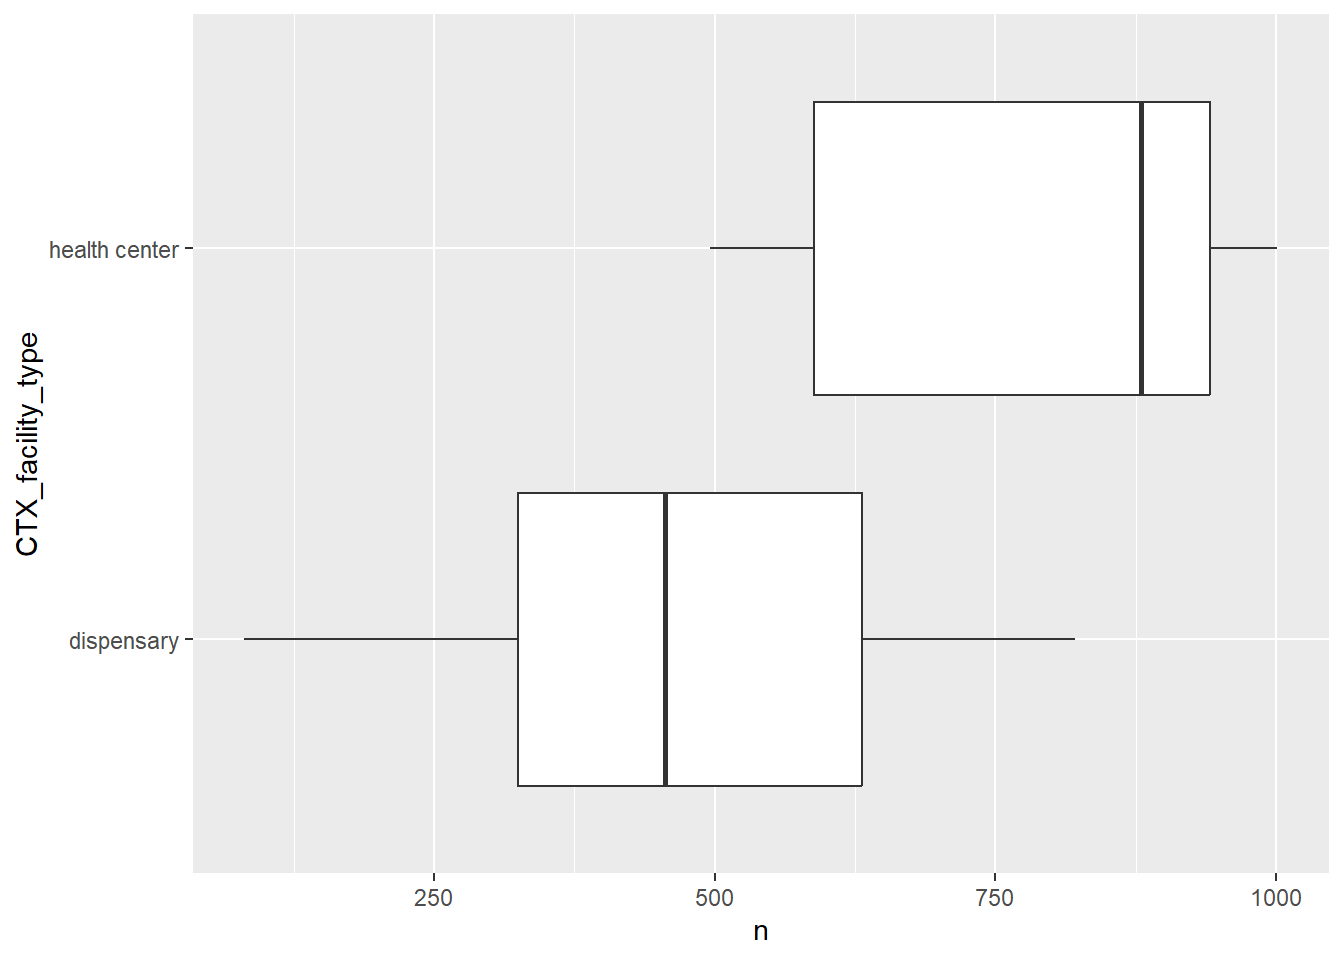
21.2.2 Consultations by type of facility
Describe the distribution of consultations in dispensaries vs. health centres.
| Type | Freq |
|---|---|
| dispensary | 0.5431704 |
| health center | 0.4568296 |
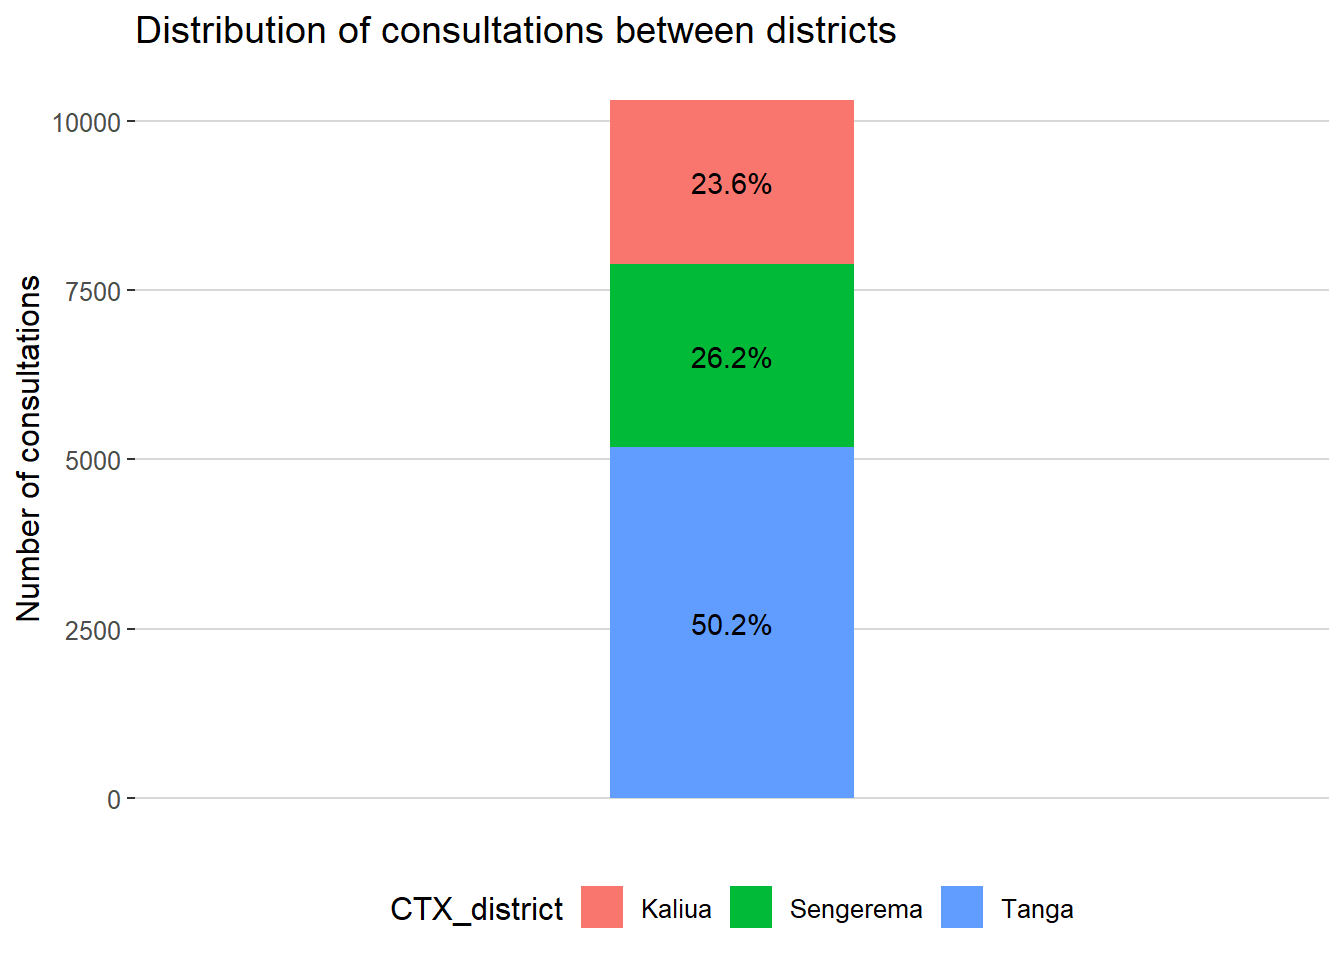
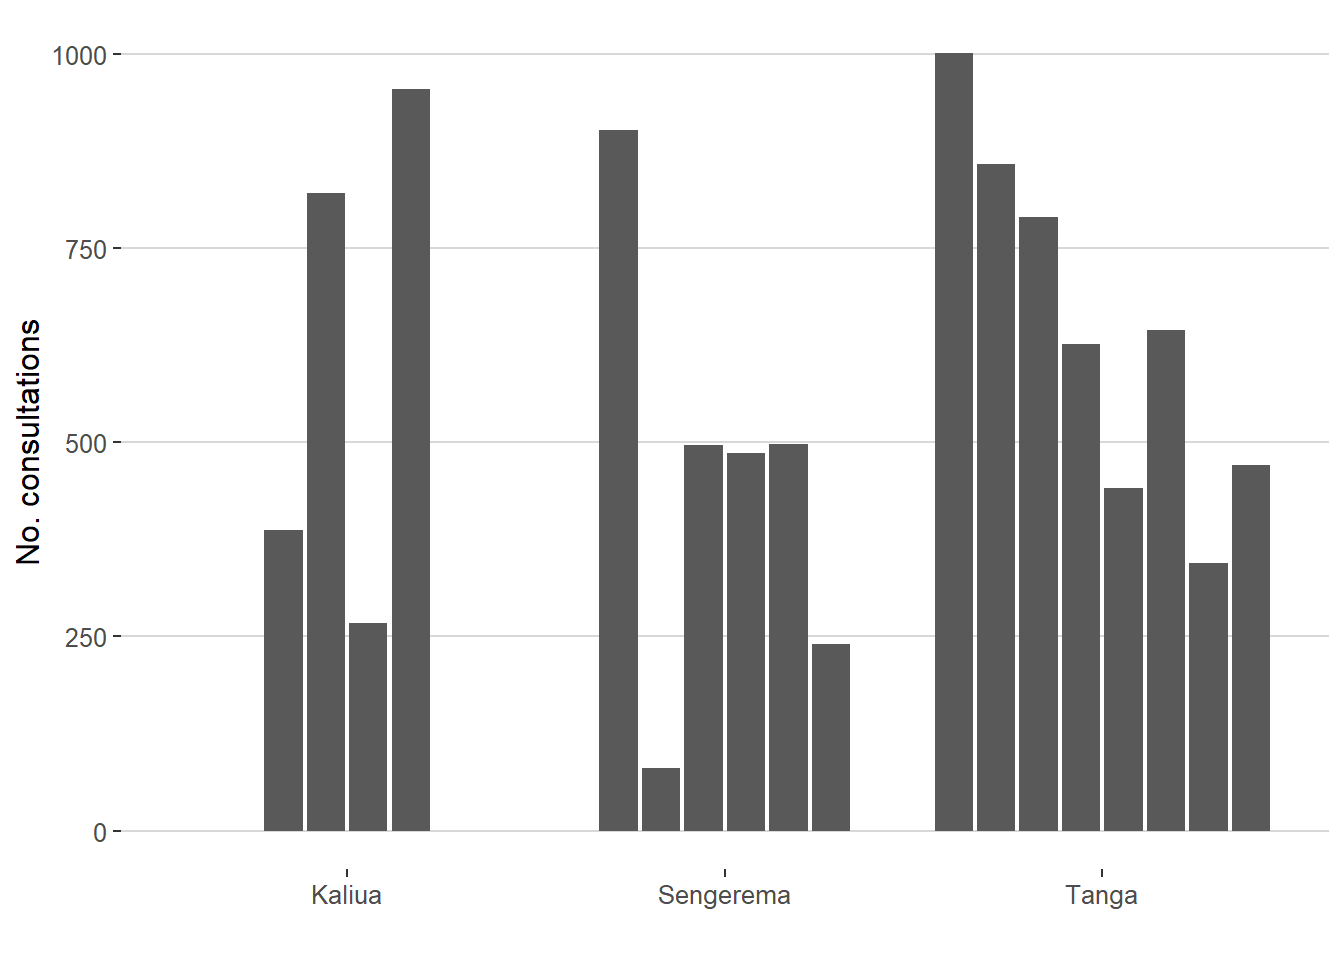
21.2.3 Consultations by district
Describe the distribution of consultations by district (Kaliua vs. Sengerema vs. tanga)
| District | Freq |
|---|---|
| Kaliua | 0.2356422 |
| Sengerema | 0.2622235 |
| Tanga | 0.5021343 |
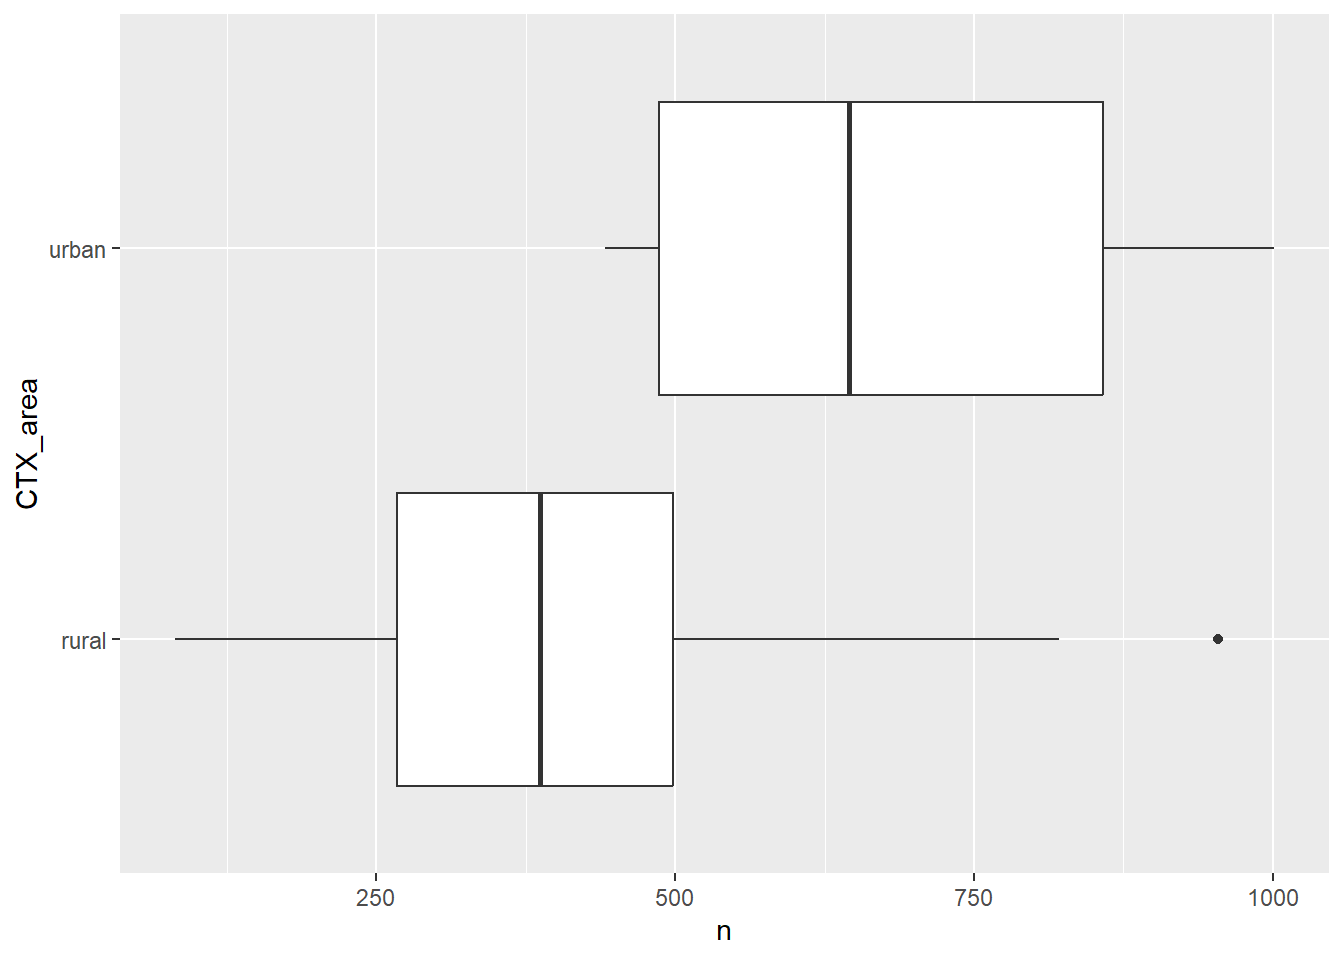
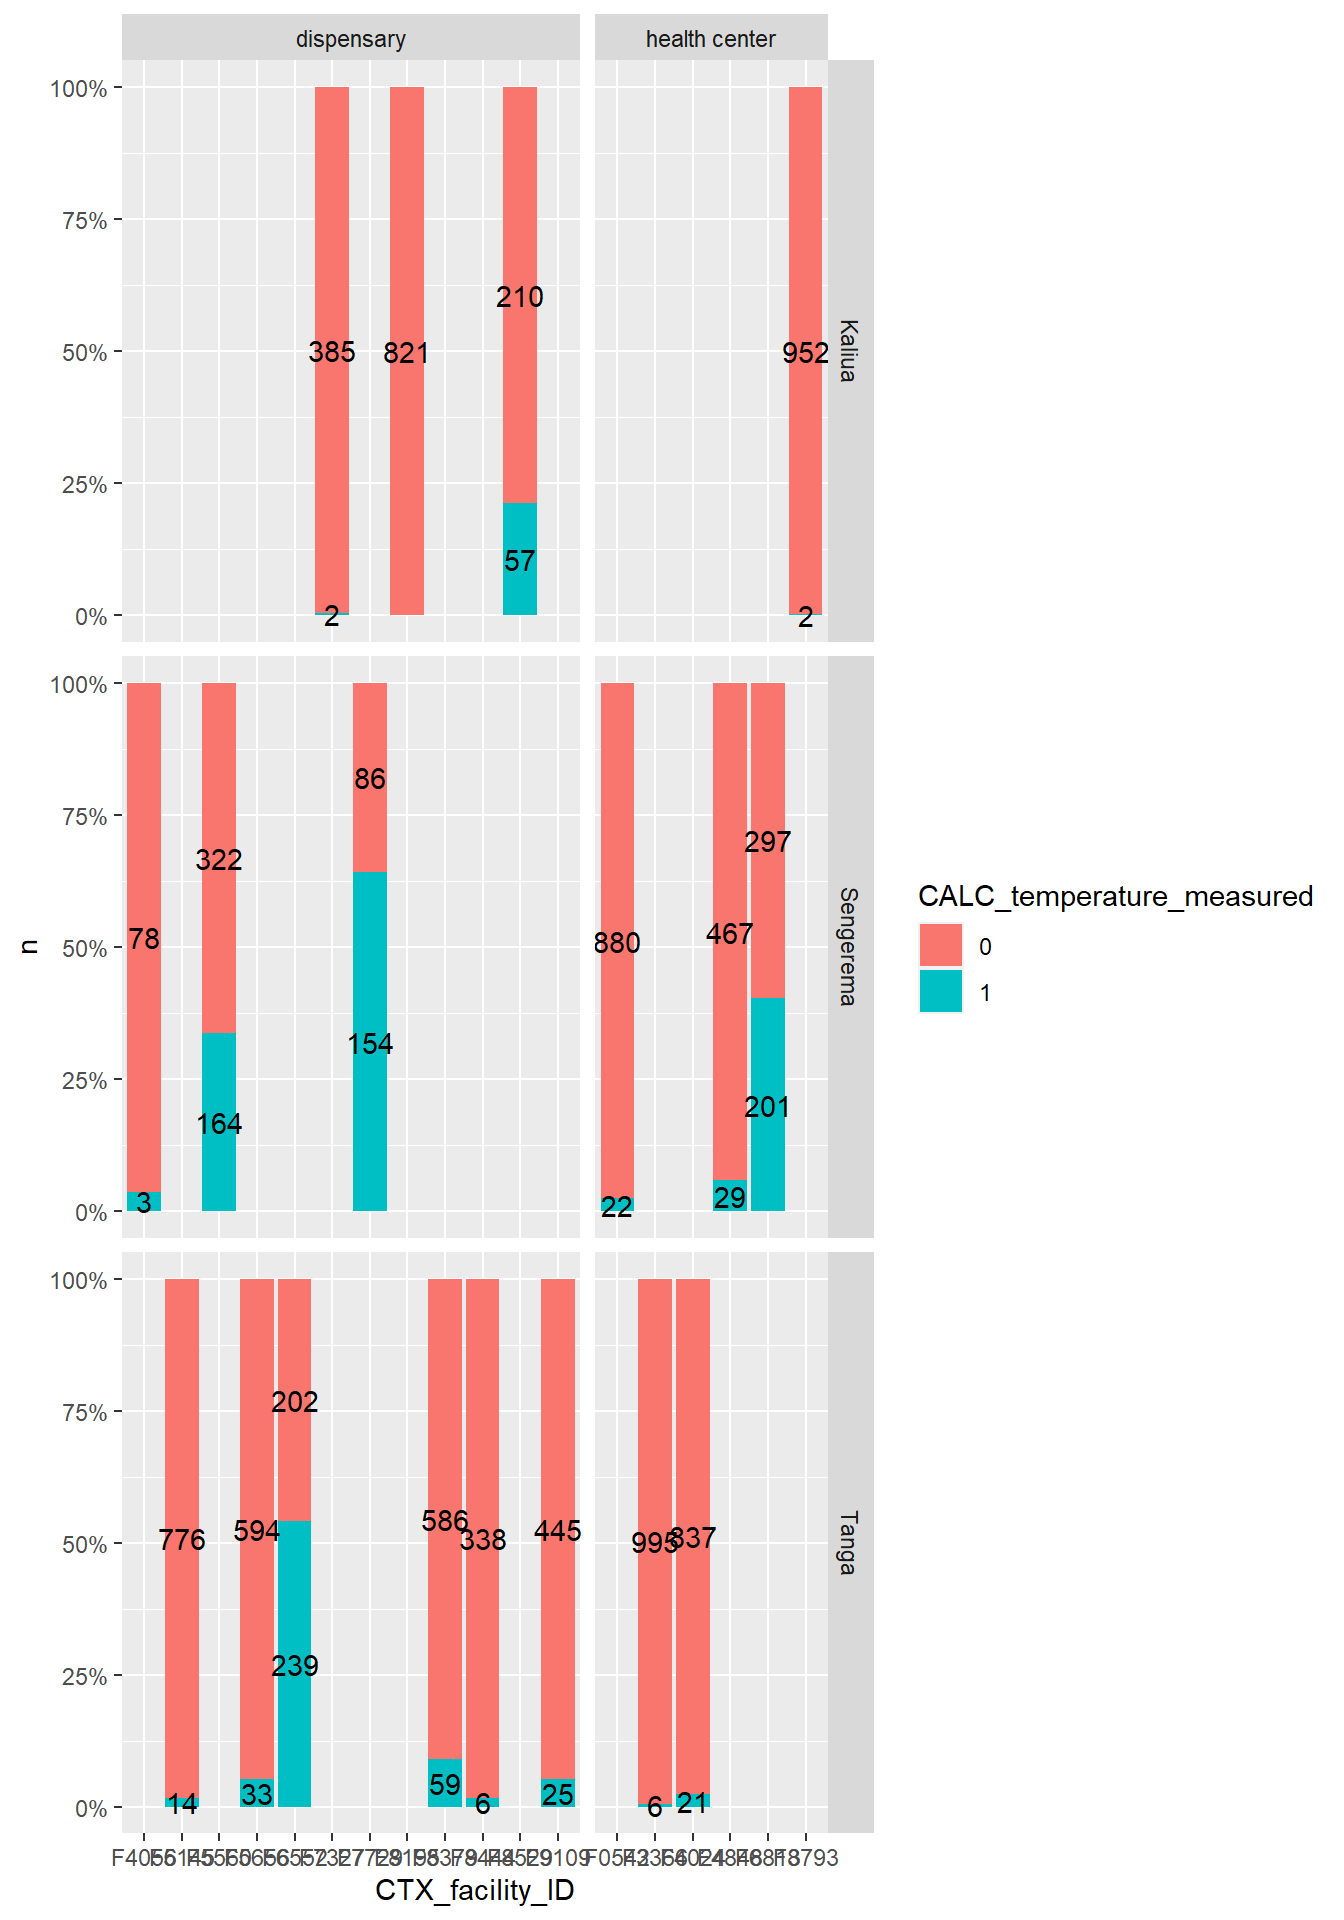
21.2.3.1 Number of consultations by facility within each district
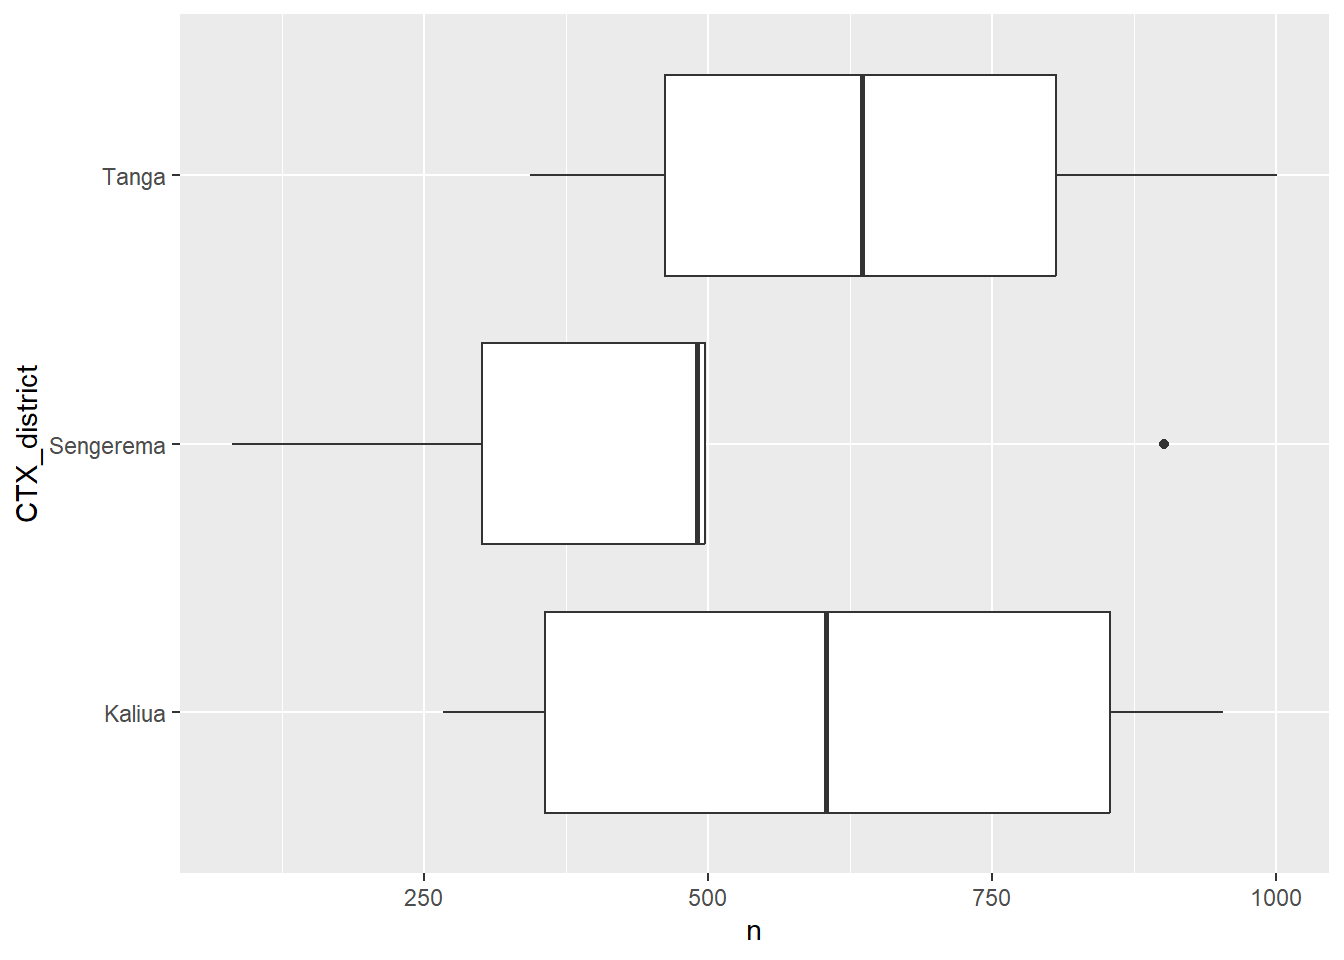
21.2.4 Consultations by area, type of facility and district
| Area | Type | District | Freq |
|---|---|---|---|
| rural | dispensary | Kaliua | 1475 |
| urban | dispensary | Kaliua | 0 |
| rural | health center | Kaliua | 954 |
| urban | health center | Kaliua | 0 |
| rural | dispensary | Sengerema | 321 |
| urban | dispensary | Sengerema | 486 |
| rural | health center | Sengerema | 994 |
| urban | health center | Sengerema | 902 |
| rural | dispensary | Tanga | 344 |
| urban | dispensary | Tanga | 2973 |
| rural | health center | Tanga | 0 |
| urban | health center | Tanga | 1859 |
21.3 Patient characteristics
Describe and critically discuss the demographics, clinical presentation and clinical history of patients.
| Characteristic | N = 10,3081 |
|---|---|
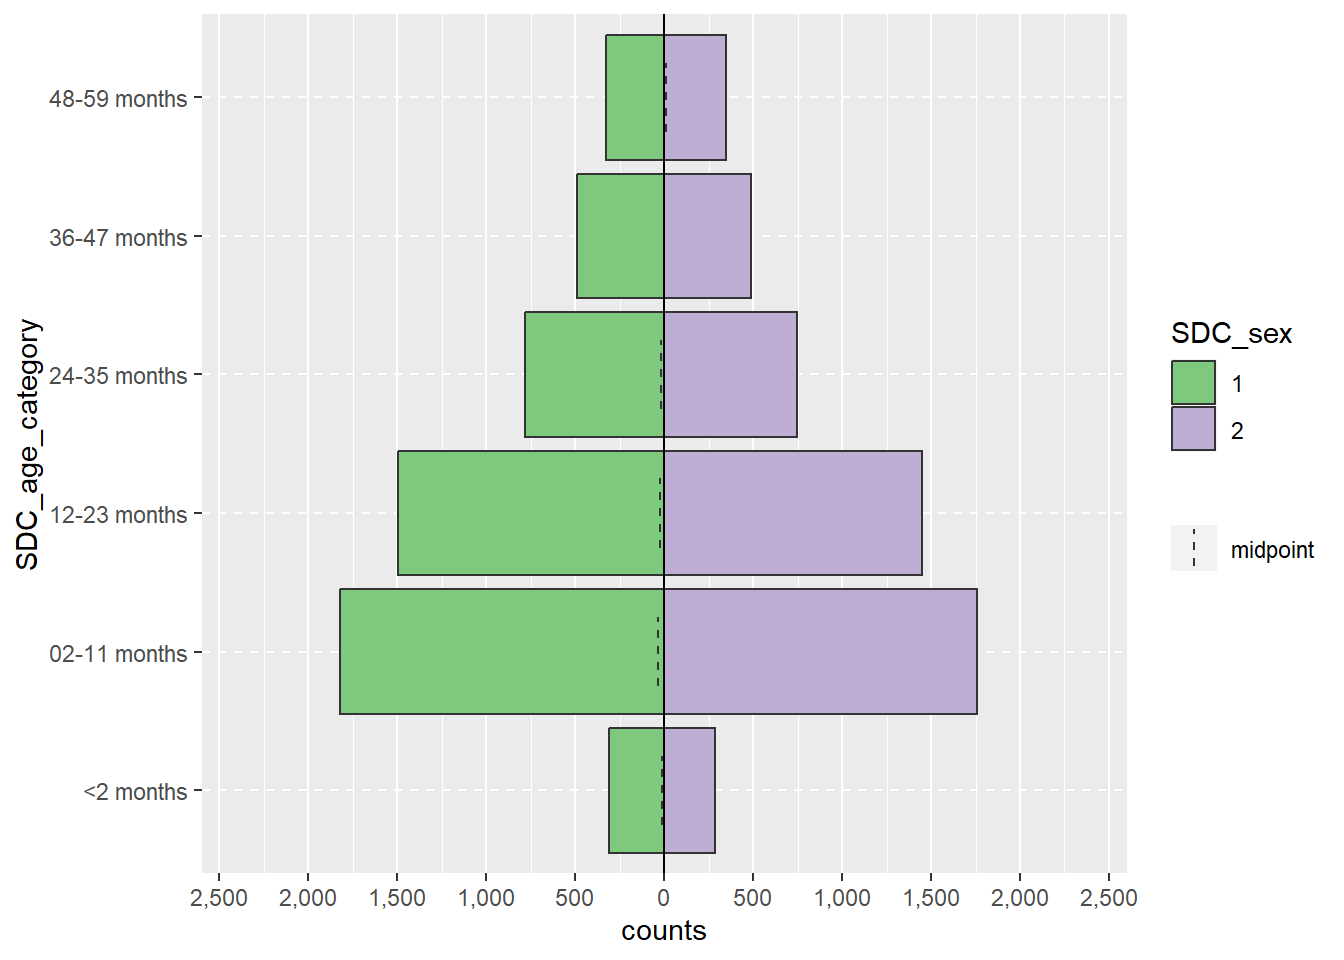
| SDC_age_category | |
| <2 months | 597 (5.8%) |
| 02-11 months | 3,576 (35%) |
| 12-23 months | 2,947 (29%) |
| 24-35 months | 1,529 (15%) |
| 36-47 months | 980 (9.5%) |
| 48-59 months | 679 (6.6%) |
| SDC_sex | |
| 1 | 5,229 (51%) |
| 2 | 5,075 (49%) |
| (Missing) | 4 |
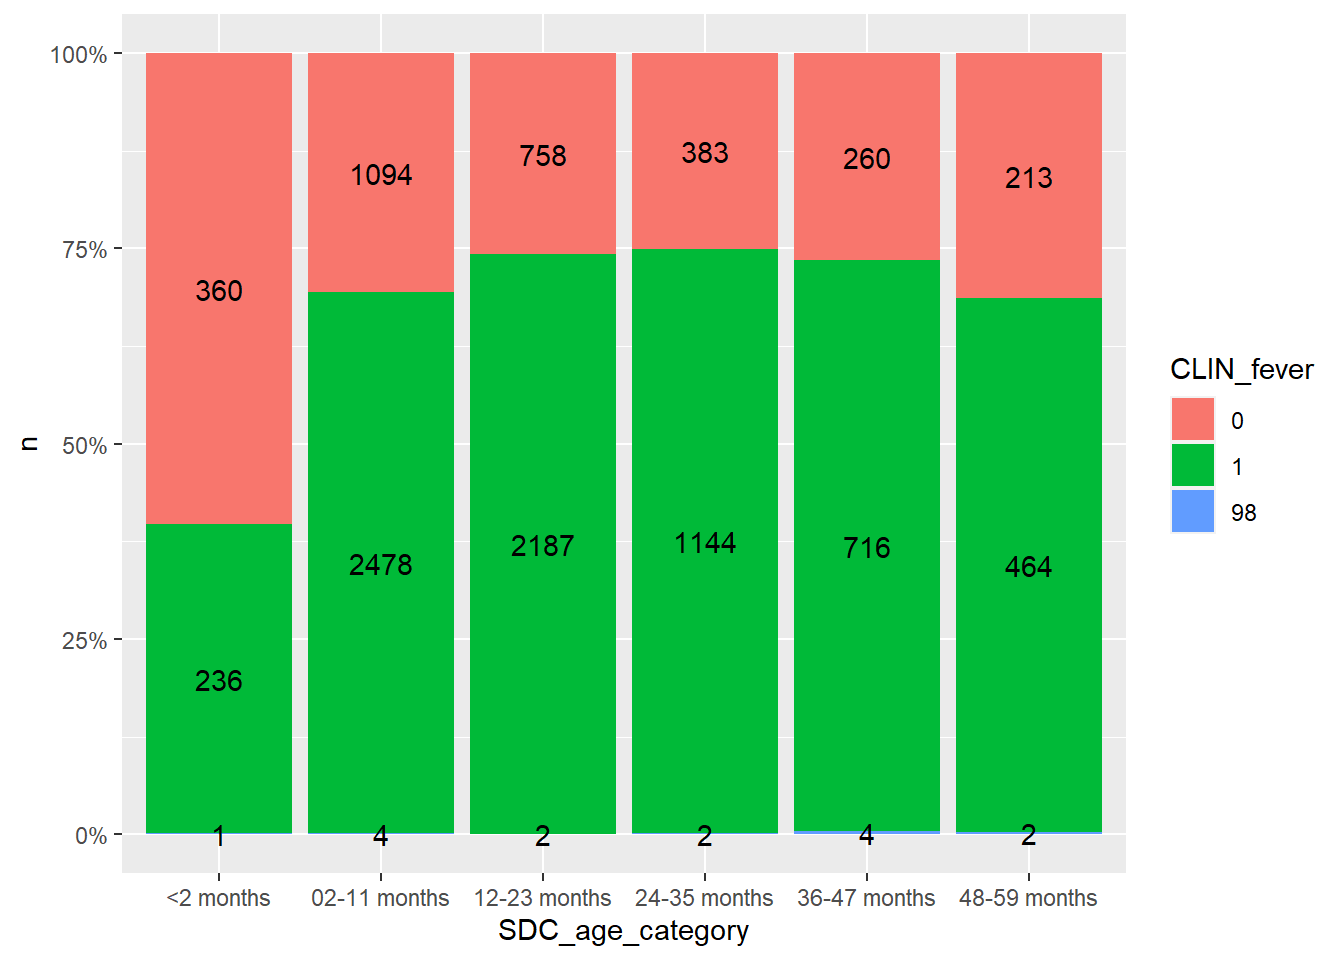
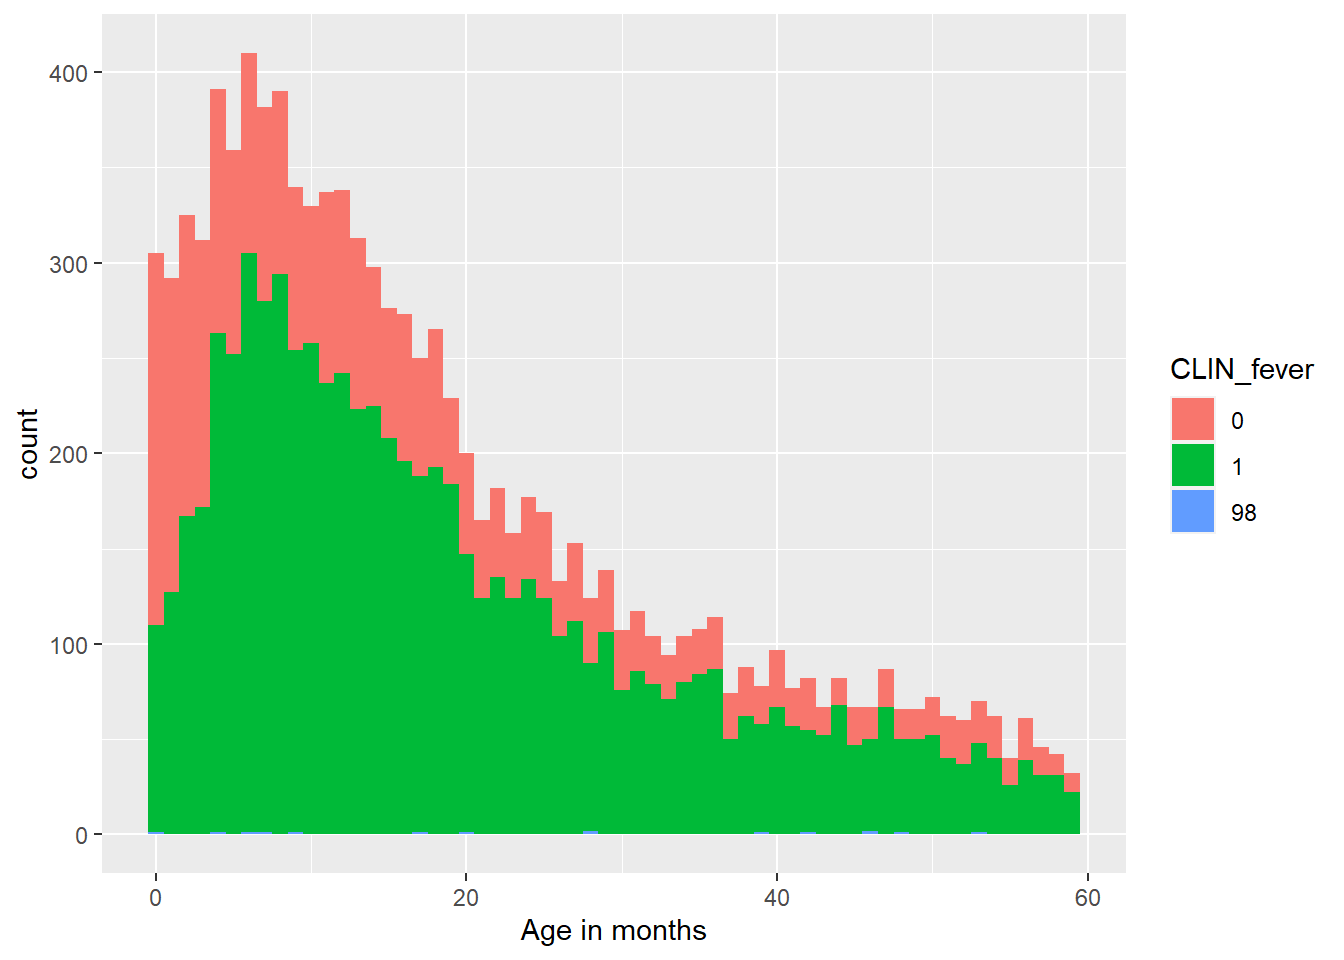
| CLIN_fever | |
| 0 | 3,068 (30%) |
| 1 | 7,225 (70%) |
| 98 | 15 (0.1%) |
| CLIN_fever_onset_category | |
| 3,083 (30%) | |
| < 2 days | 1,998 (19%) |
| >= 7 days | 343 (3.3%) |
| 2-3 days | 4,386 (43%) |
| 4-6 days | 498 (4.8%) |
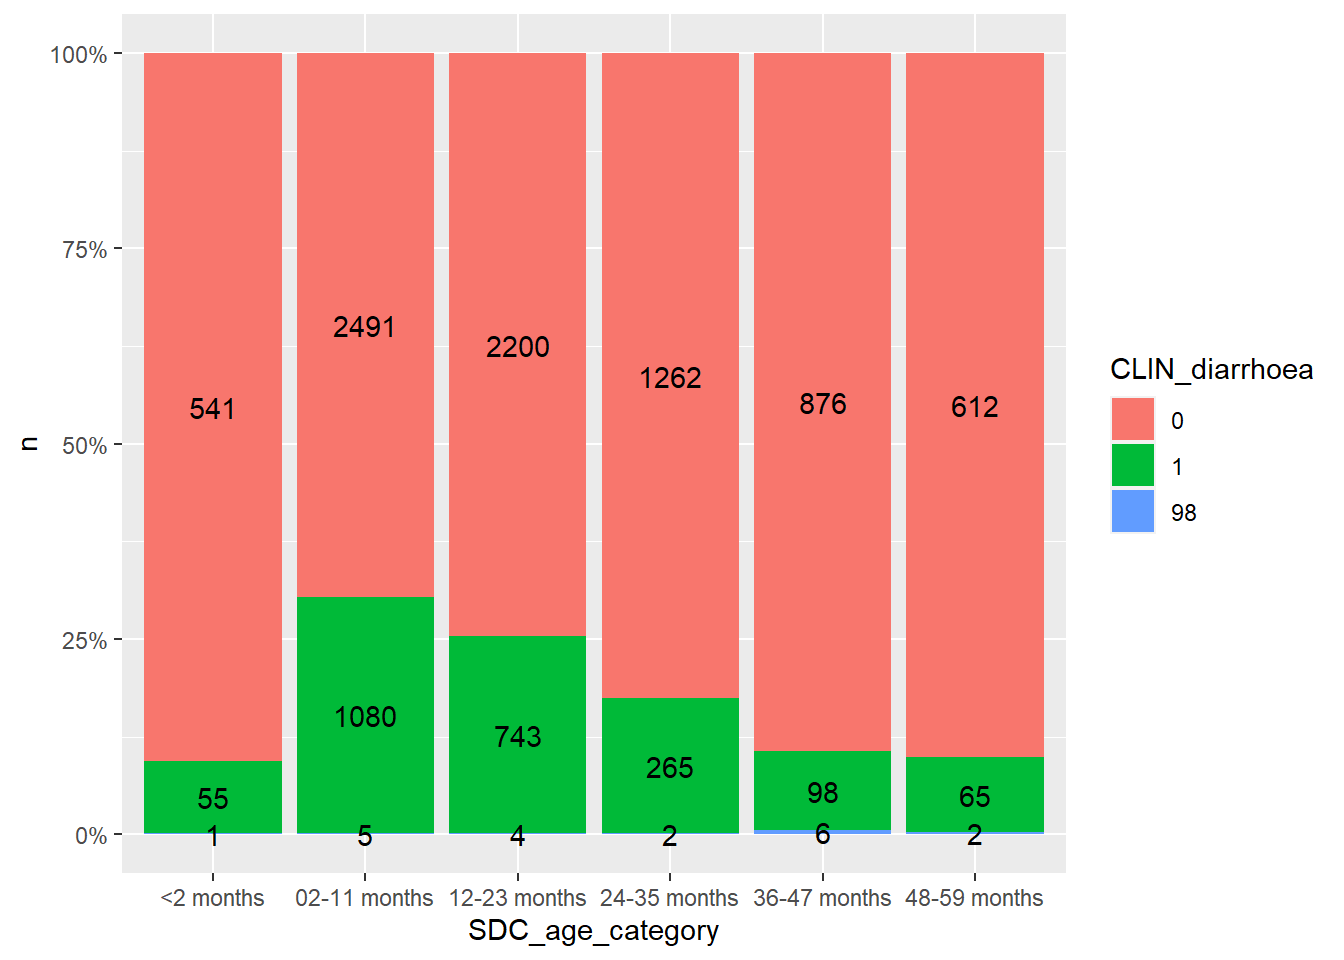
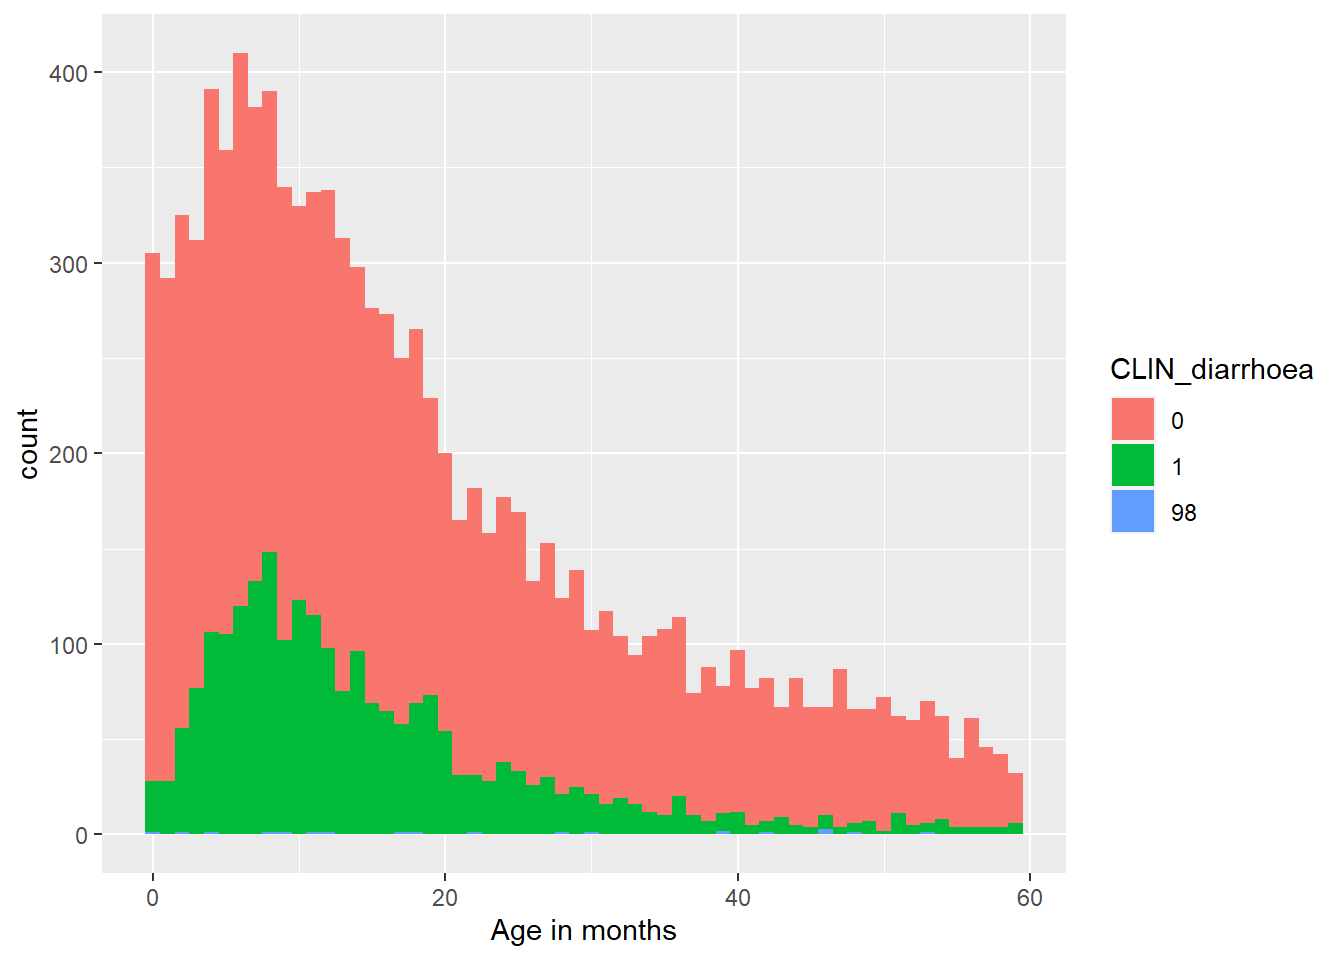
| CLIN_diarrhoea | |
| 0 | 7,982 (77%) |
| 1 | 2,306 (22%) |
| 98 | 20 (0.2%) |
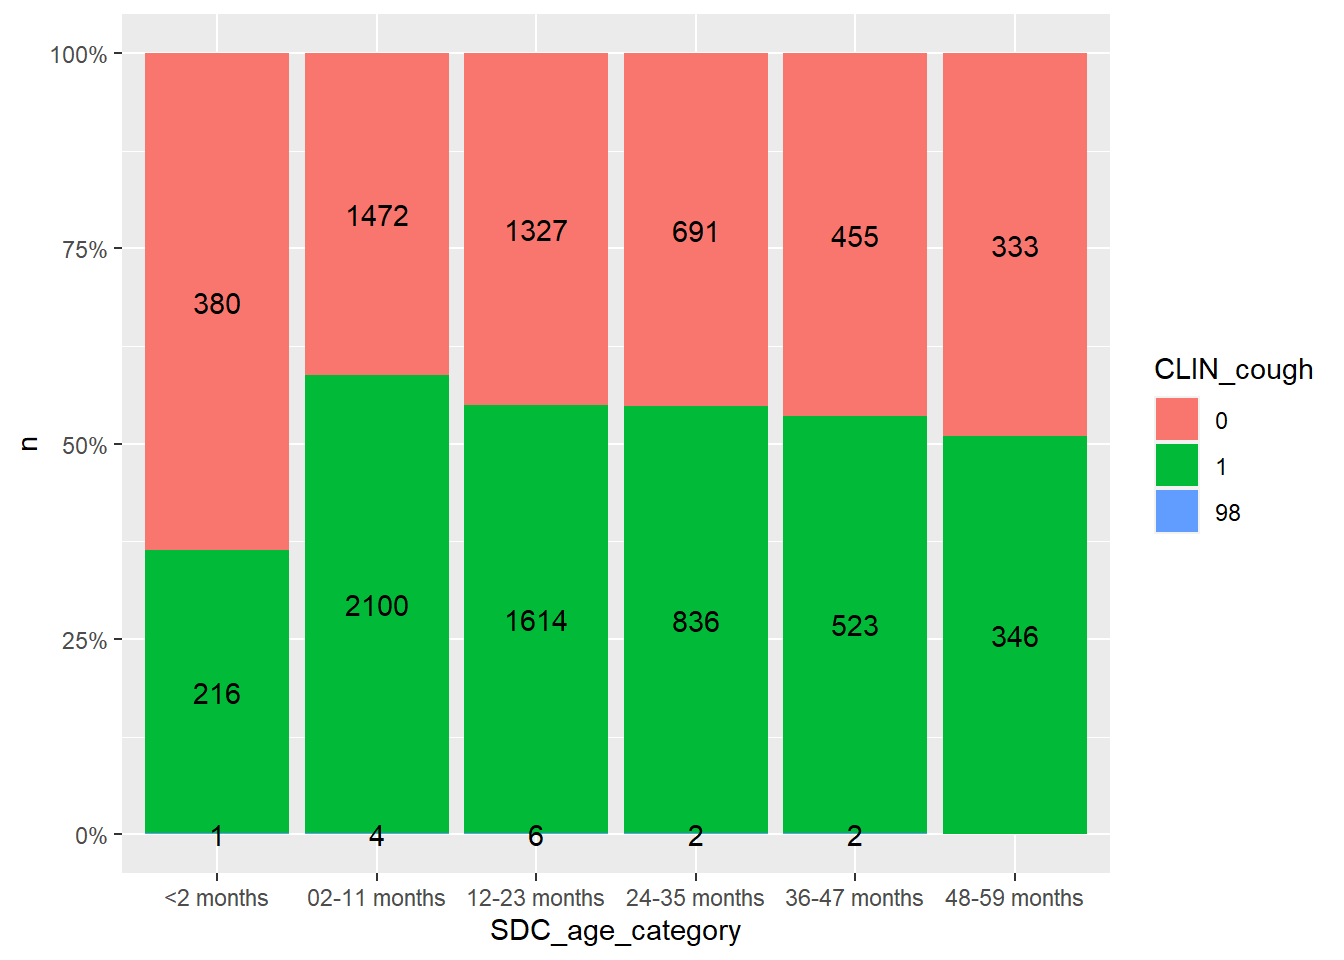
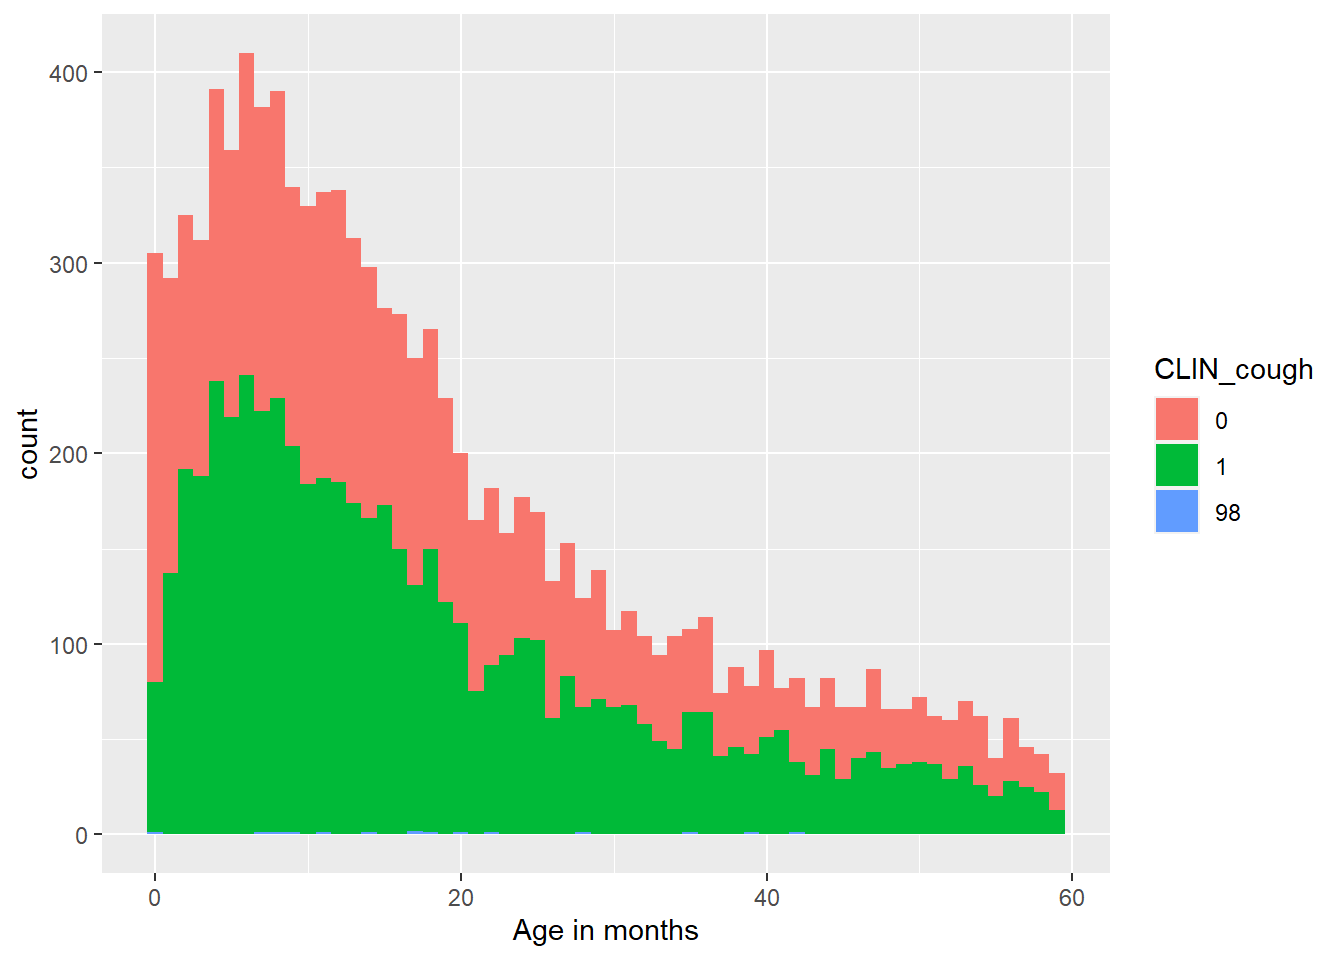
| CLIN_cough | |
| 0 | 4,658 (45%) |
| 1 | 5,635 (55%) |
| 98 | 15 (0.1%) |
| RX_preconsult_antibiotics | |
| 0 | 8,573 (83%) |
| 1 | 1,735 (17%) |
| RX_preconsult_antimalarials | |
| 0 | 9,866 (96%) |
| 1 | 442 (4.3%) |
| 1 n (%) | |
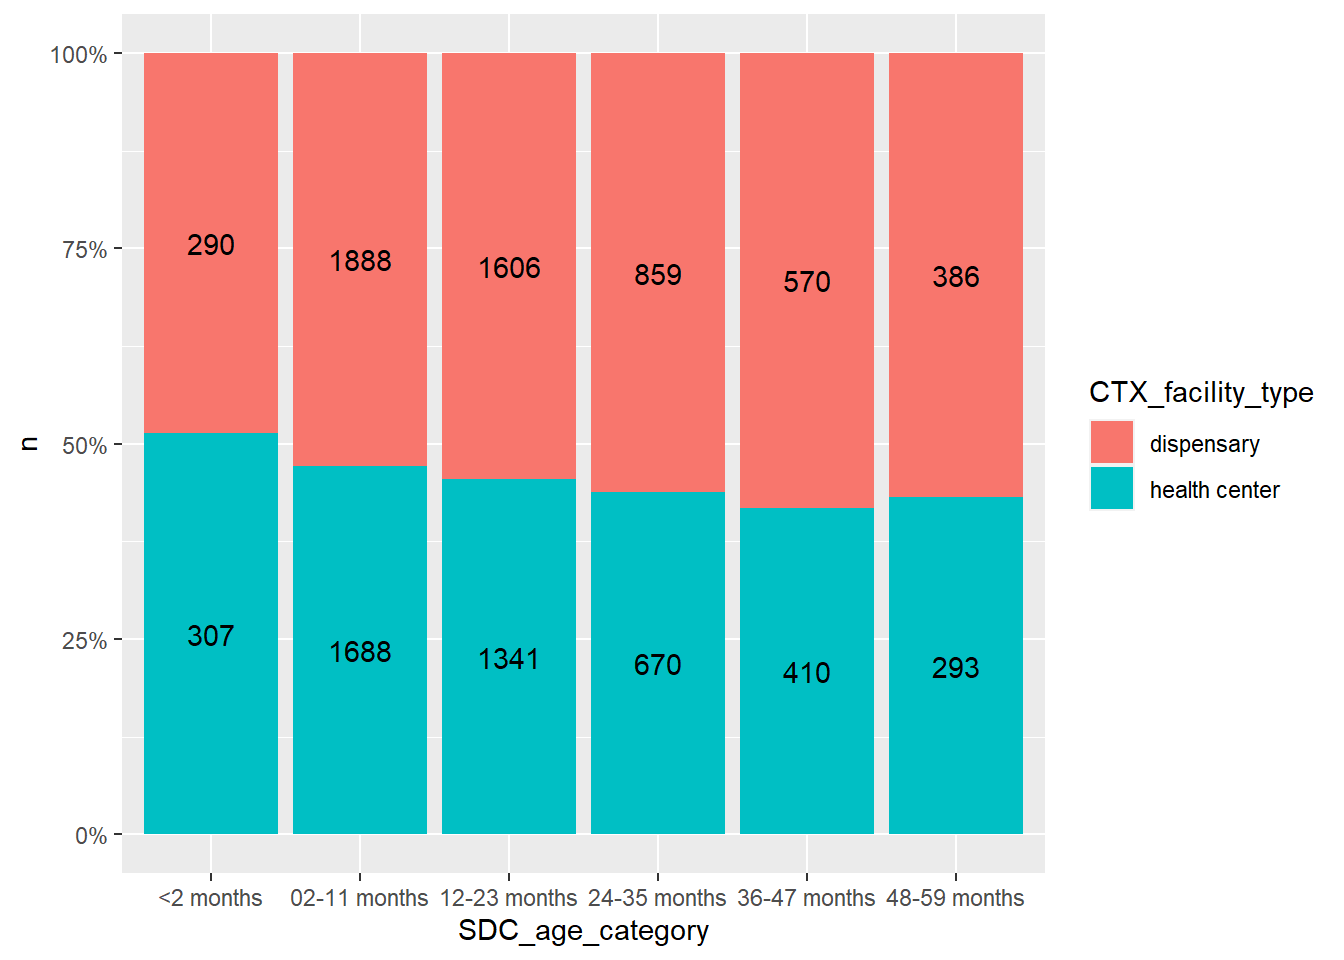
| Characteristic | dispensary, N = 5,5991 | health center, N = 4,7091 |
|---|---|---|
| SDC_age_category | ||
| <2 months | 290 (5.2%) | 307 (6.5%) |
| 02-11 months | 1,888 (34%) | 1,688 (36%) |
| 12-23 months | 1,606 (29%) | 1,341 (28%) |
| 24-35 months | 859 (15%) | 670 (14%) |
| 36-47 months | 570 (10%) | 410 (8.7%) |
| 48-59 months | 386 (6.9%) | 293 (6.2%) |
| SDC_sex | ||
| 1 | 2,810 (50%) | 2,419 (51%) |
| 2 | 2,786 (50%) | 2,289 (49%) |
| (Missing) | 3 | 1 |
| CLIN_fever | ||
| 0 | 1,710 (31%) | 1,358 (29%) |
| 1 | 3,881 (69%) | 3,344 (71%) |
| 98 | 8 (0.1%) | 7 (0.1%) |
| CLIN_fever_onset_category | ||
| 1,718 (31%) | 1,365 (29%) | |
| < 2 days | 1,167 (21%) | 831 (18%) |
| >= 7 days | 149 (2.7%) | 194 (4.1%) |
| 2-3 days | 2,333 (42%) | 2,053 (44%) |
| 4-6 days | 232 (4.1%) | 266 (5.6%) |
| CLIN_diarrhoea | ||
| 0 | 4,457 (80%) | 3,525 (75%) |
| 1 | 1,135 (20%) | 1,171 (25%) |
| 98 | 7 (0.1%) | 13 (0.3%) |
| CLIN_cough | ||
| 0 | 2,365 (42%) | 2,293 (49%) |
| 1 | 3,226 (58%) | 2,409 (51%) |
| 98 | 8 (0.1%) | 7 (0.1%) |
| RX_preconsult_antibiotics | ||
| 0 | 4,828 (86%) | 3,745 (80%) |
| 1 | 771 (14%) | 964 (20%) |
| RX_preconsult_antimalarials | ||
| 0 | 5,468 (98%) | 4,398 (93%) |
| 1 | 131 (2.3%) | 311 (6.6%) |
| 1 n (%) | ||
21.3.1 Demographics
21.3.2 Clinical presentation
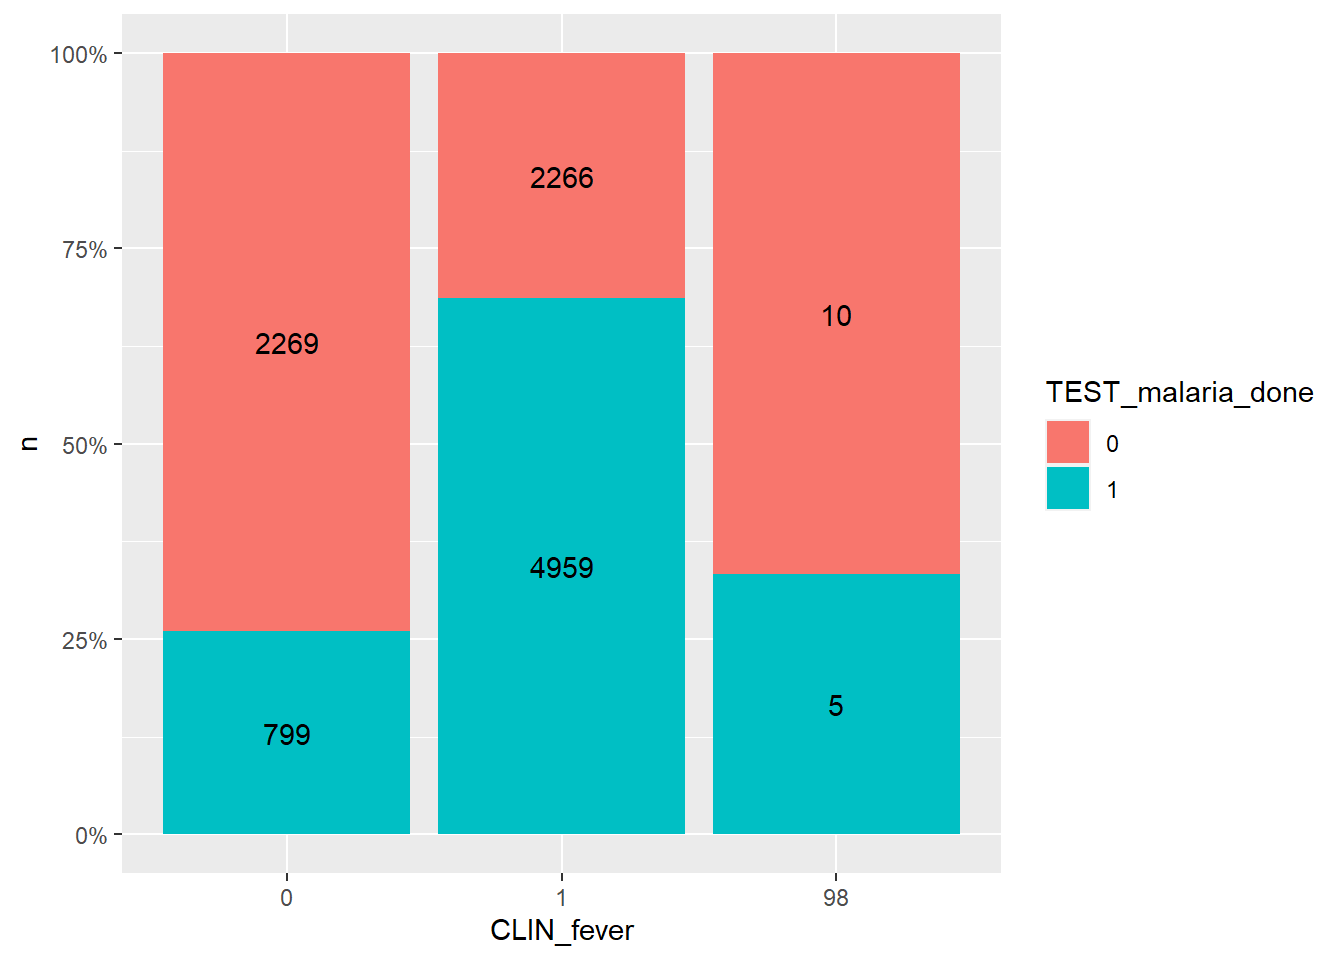
21.3.2.1 Fever
21.3.2.2 Cough
21.3.2.3 Diarrhoea
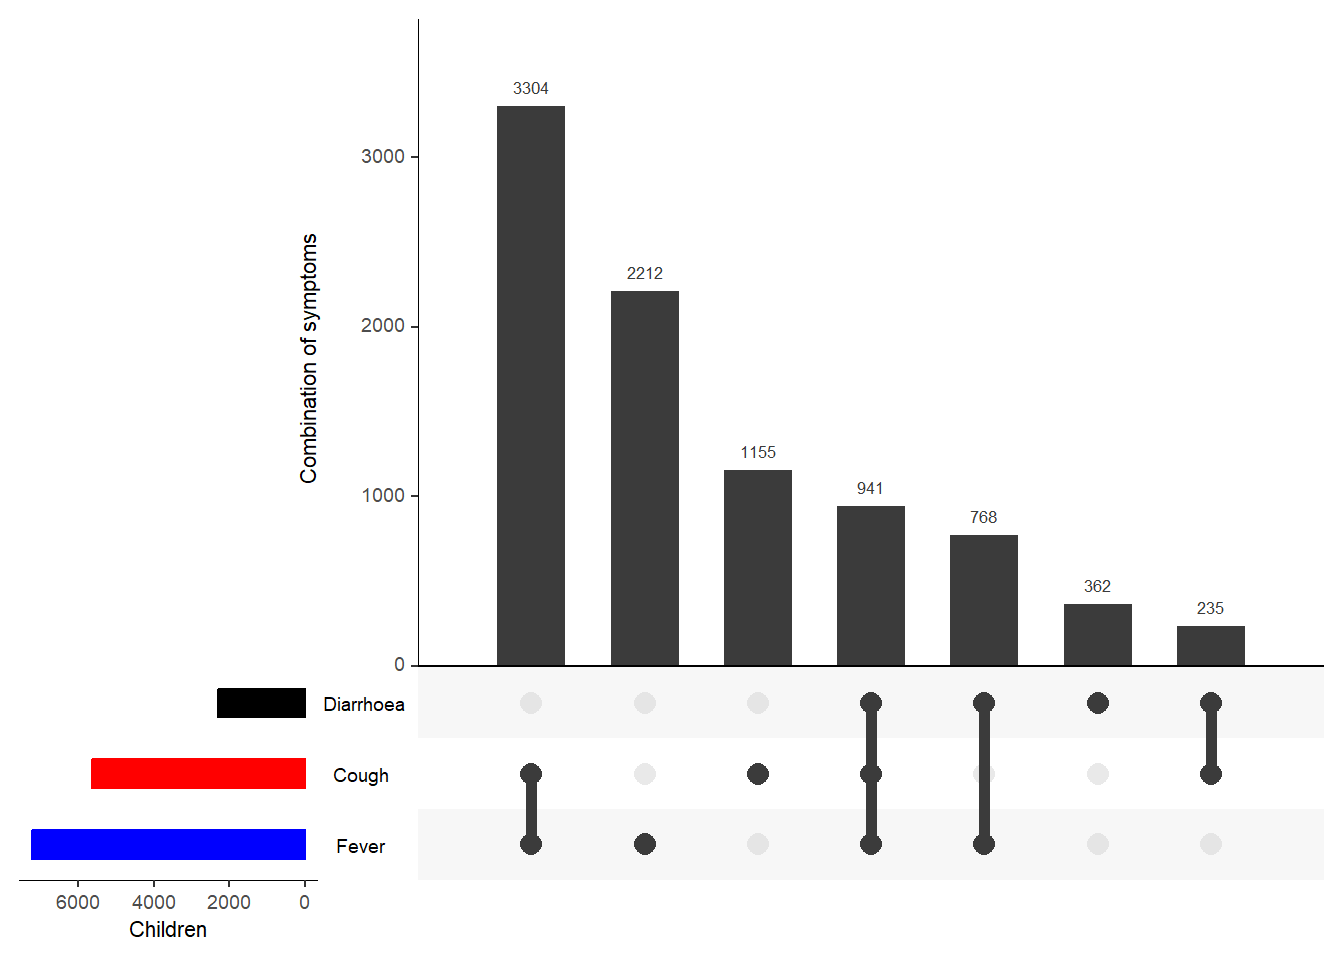
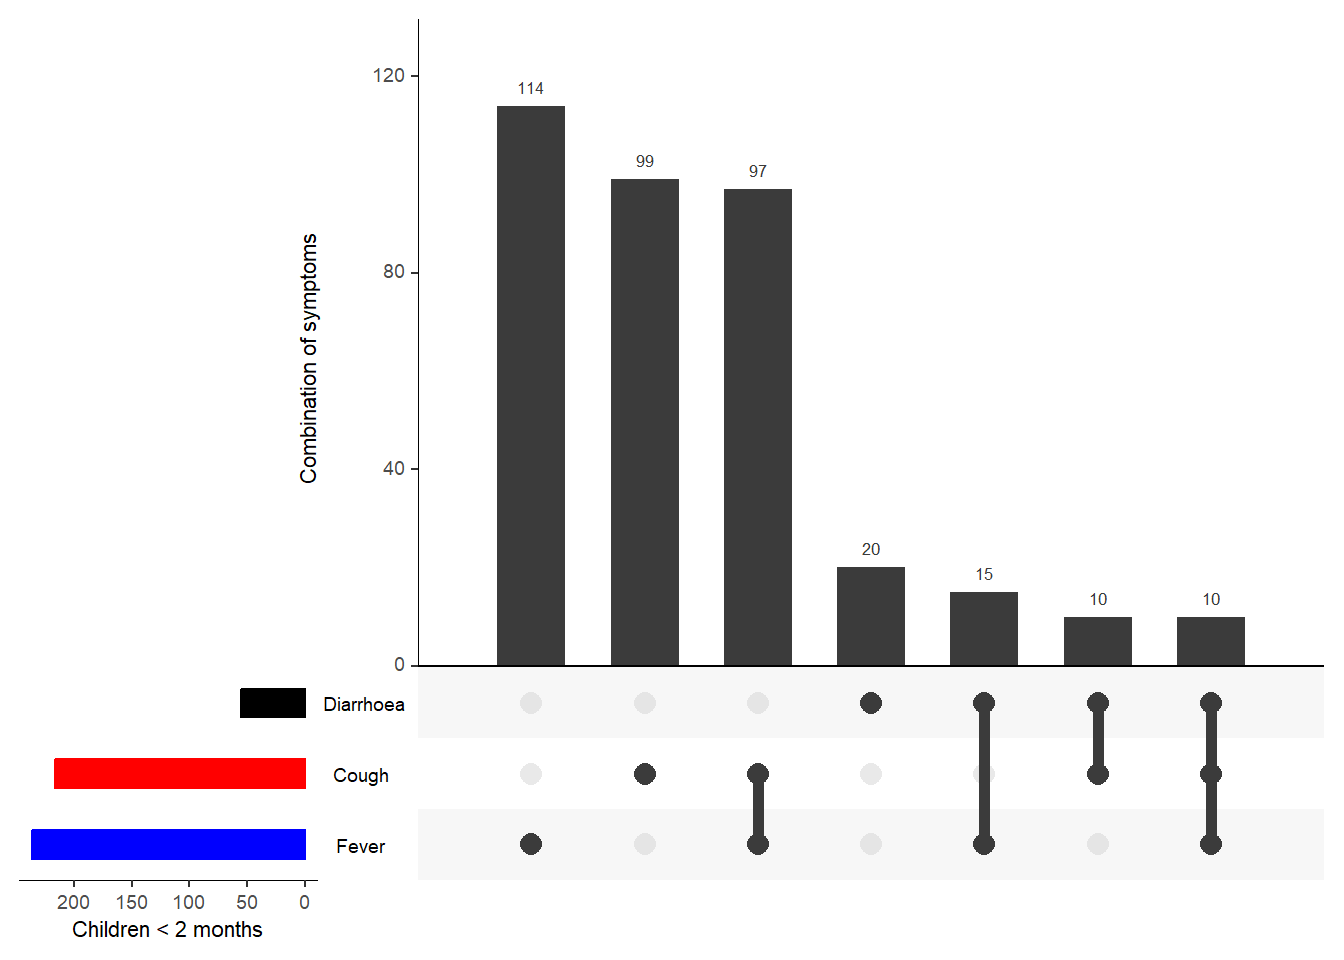
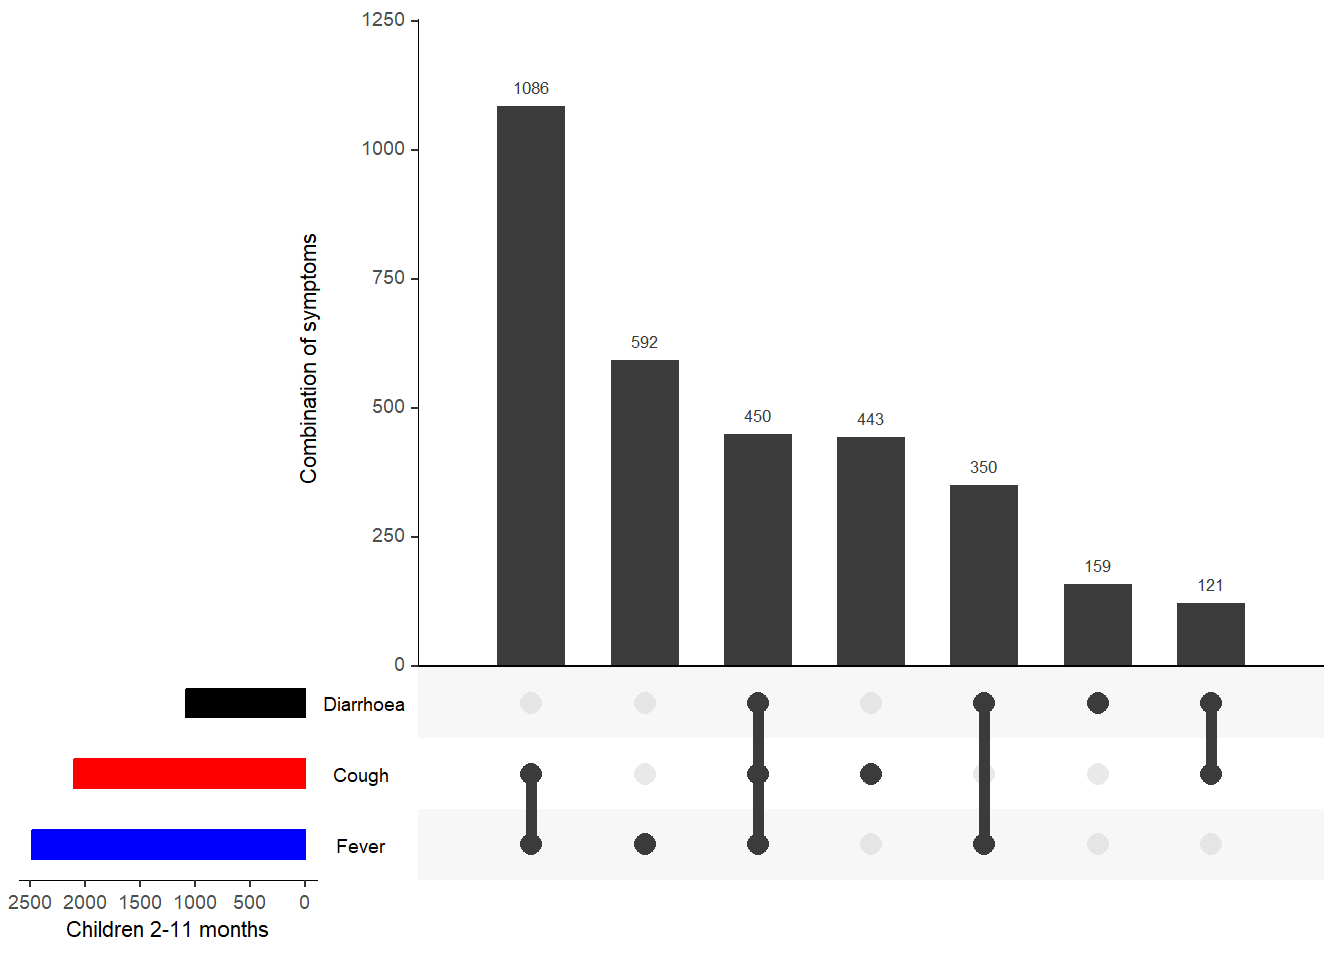
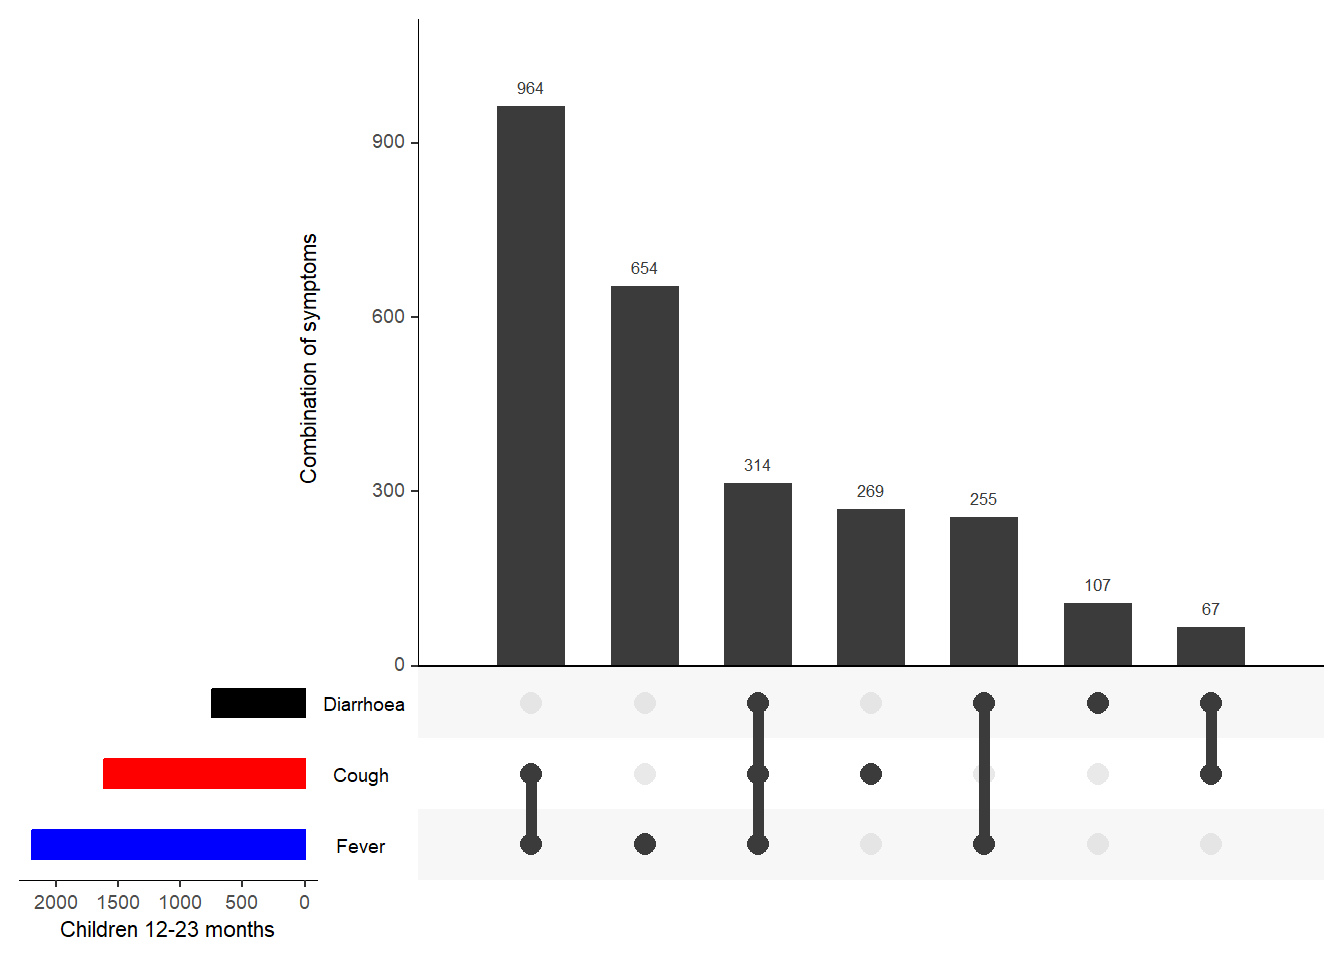
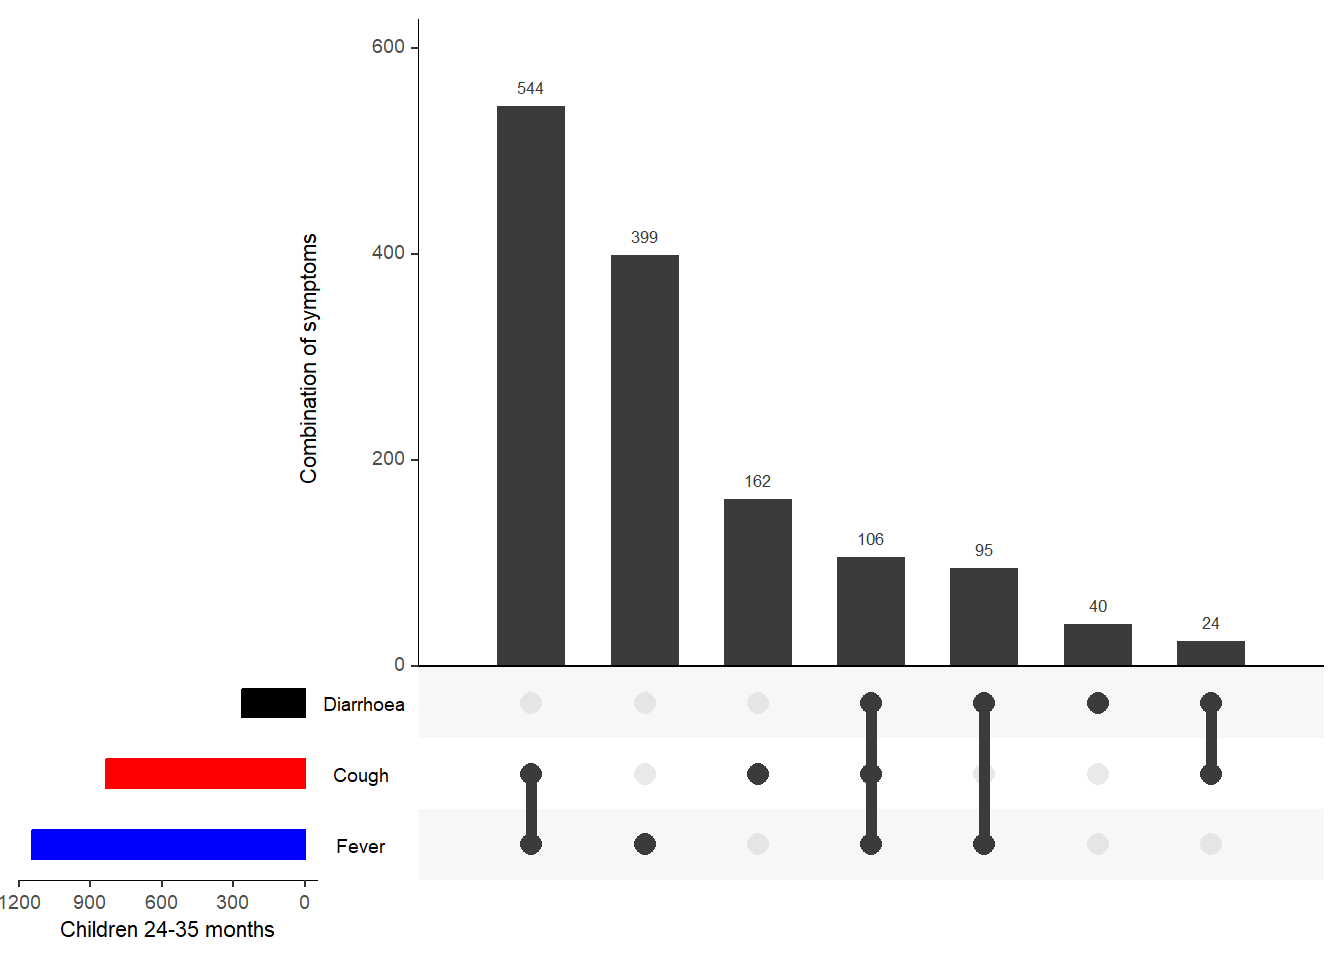
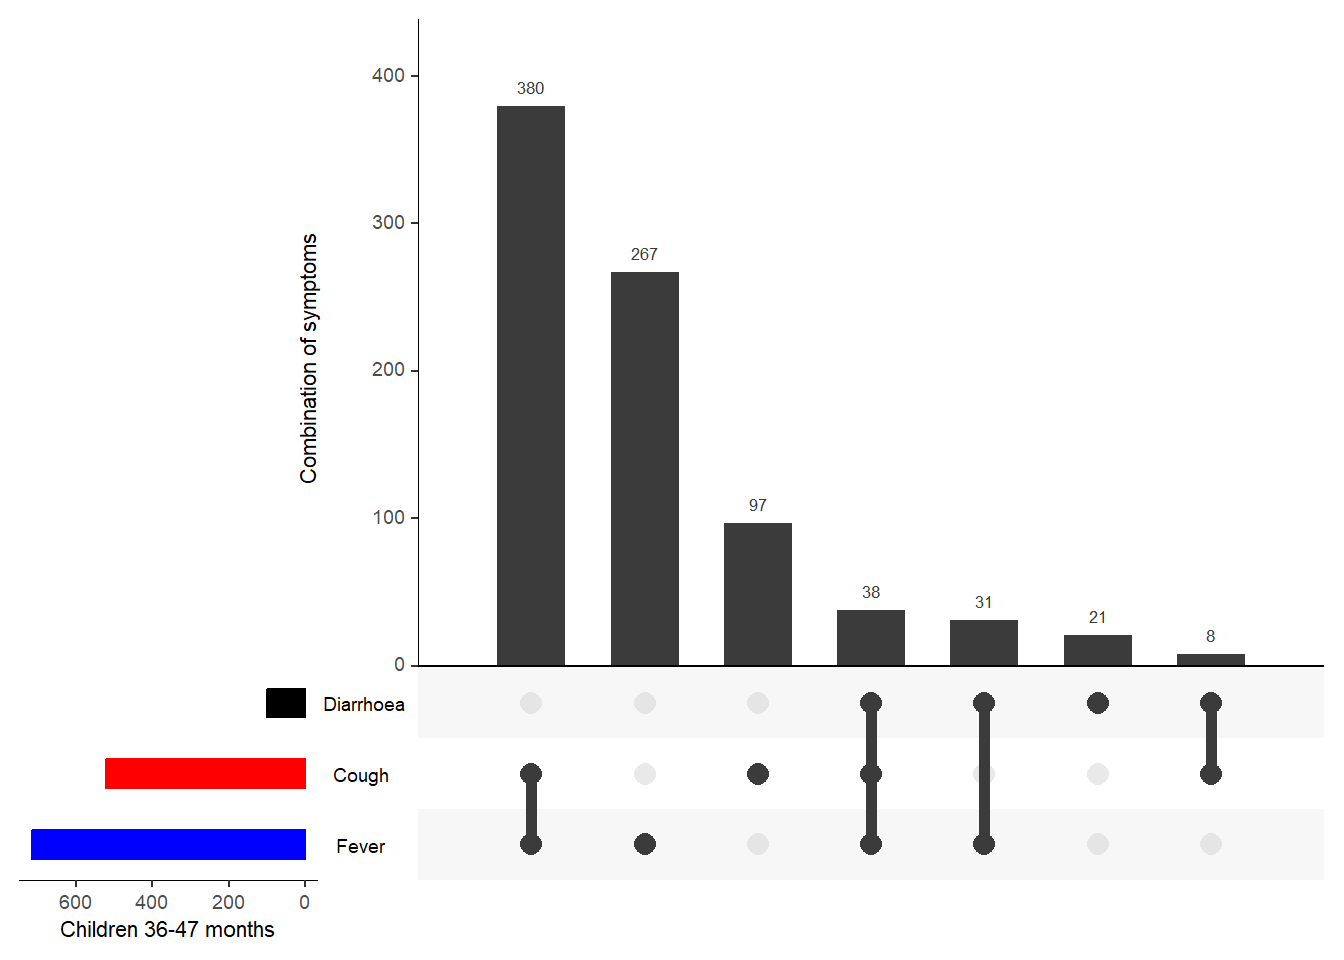
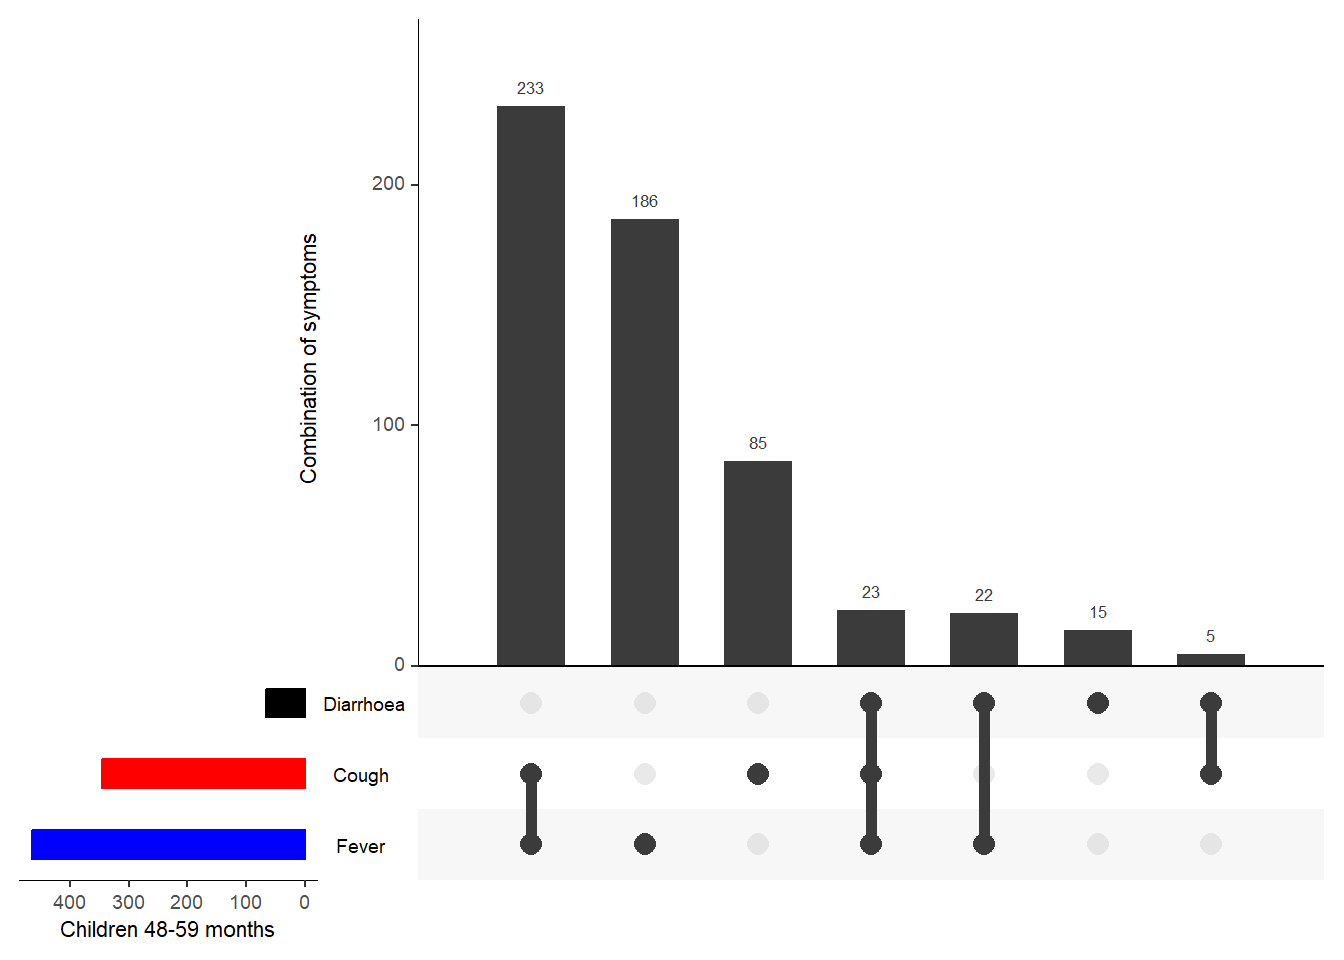
21.3.2.4 Combination of symptoms
21.4 Clinical assessments conducted during the consultation
Describe and critically discuss the clinical assessments (fever assessment, malaria test) conducted during the consultation.
| Characteristic | N = 10,3081 |
|---|---|
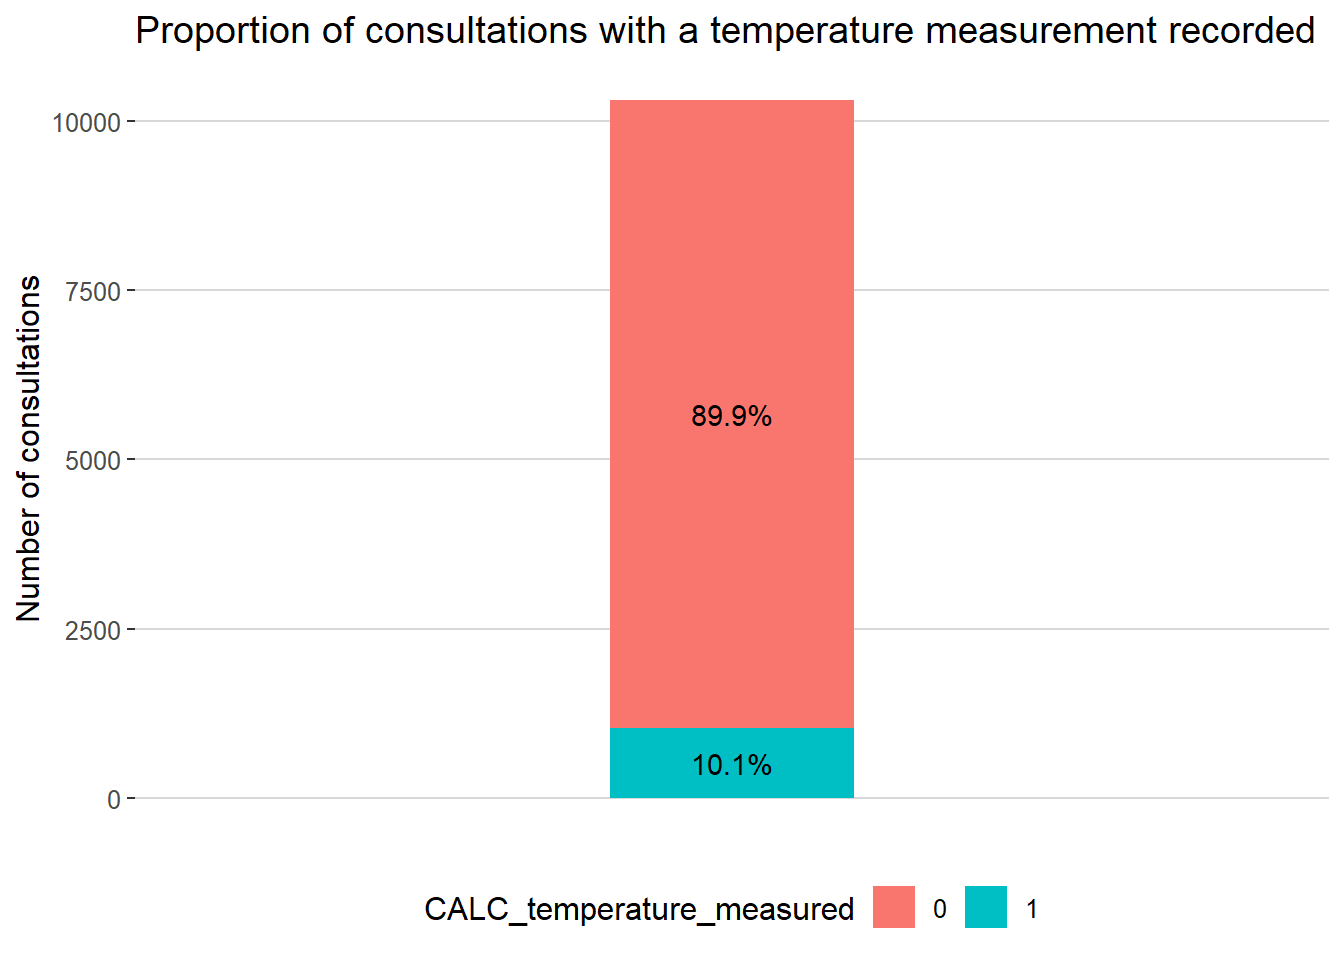
| CALC_temperature_measured | |
| 0 | 9,271 (90%) |
| 1 | 1,037 (10%) |
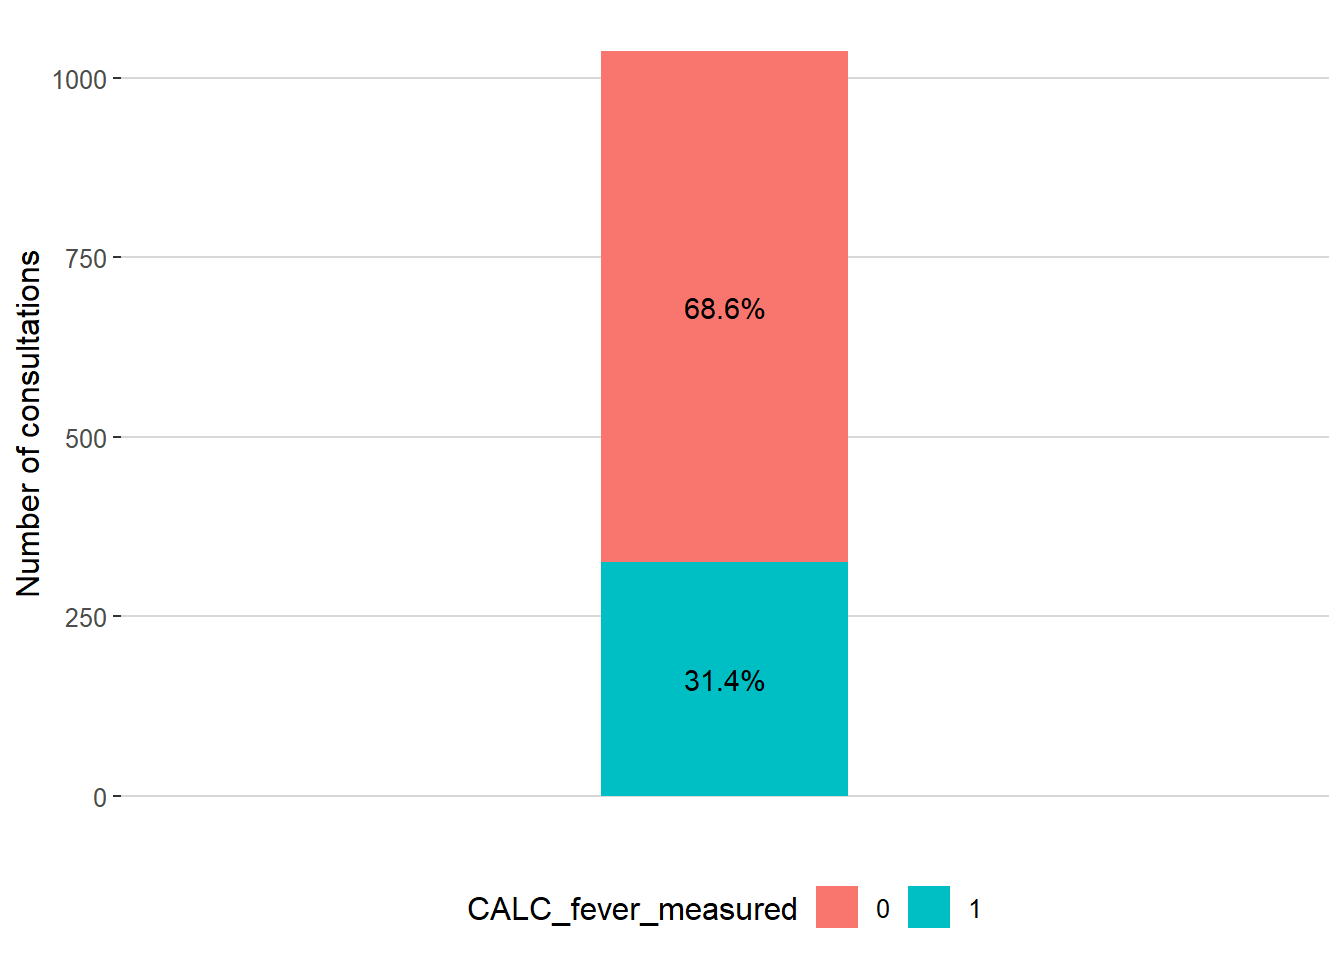
| CALC_fever_measured | |
| 0 | 711 (69%) |
| 1 | 326 (31%) |
| (Missing) | 9,271 |
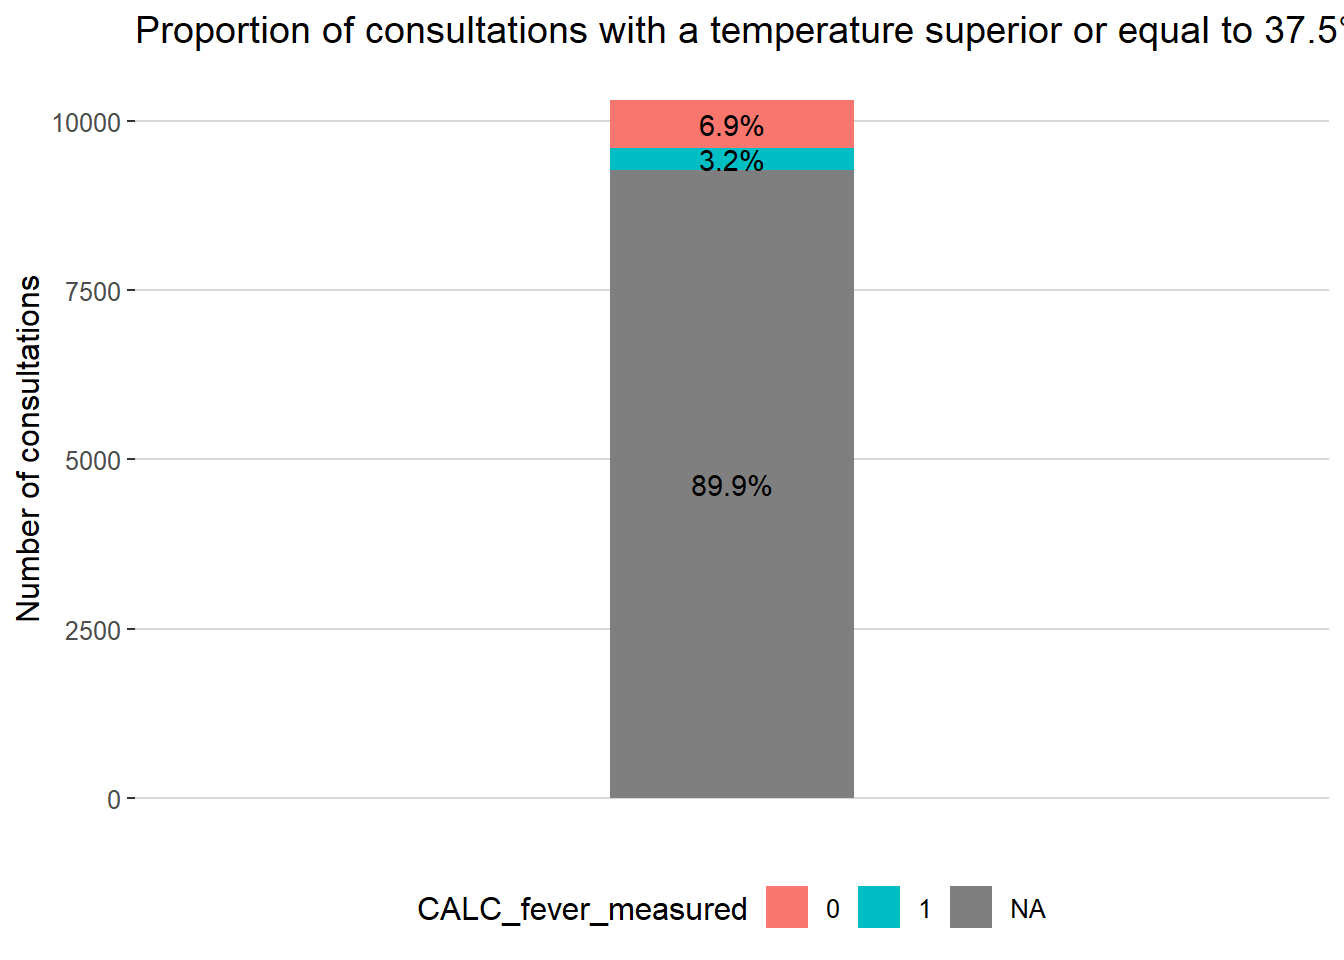
| CALC_fever_all | |
| 0 | 3,056 (30%) |
| 1 | 7,252 (70%) |
| TEST_malaria_done | |
| 0 | 4,545 (44%) |
| 1 | 5,763 (56%) |
| TEST_malaria_type | |
| 1 | 5,371 (93%) |
| 2 | 340 (5.9%) |
| 95 | 2 (<0.1%) |
| 98 | 45 (0.8%) |
| (Missing) | 4,550 |
| TEST_malaria_result | |
| 0 | 4,665 (81%) |
| 1 | 1,032 (18%) |
| 2 | 1 (<0.1%) |
| 95 | 3 (<0.1%) |
| 98 | 57 (1.0%) |
| (Missing) | 4,550 |
| DX_severe | |
| 0 | 10,054 (98%) |
| 1 | 254 (2.5%) |
| DX_malaria | |
| 0 | 8,508 (83%) |
| 1 | 1,800 (17%) |
| DX_malaria_severe | |
| 0 | 10,160 (99%) |
| 1 | 148 (1.4%) |
| RX_antimalarials | |
| 0 | 9,018 (87%) |
| 1 | 1,290 (13%) |
| RX_antimalarial_parenteral | |
| 0 | 10,059 (98%) |
| 1 | 249 (2.4%) |
| RX_antibiotics | |
| 0 | 4,878 (47%) |
| 1 | 5,430 (53%) |
| MGMT_referral_src_caregiver | |
| 0 | 10,122 (98%) |
| 1 | 164 (1.6%) |
| 97 | 9 (<0.1%) |
| 98 | 13 (0.1%) |
| MGMT_referral_src_registry | |
| 0 | 10,194 (99%) |
| 1 | 114 (1.1%) |
| 1 n (%) | |
| Characteristic | dispensary, N = 5,5991 | health center, N = 4,7091 |
|---|---|---|
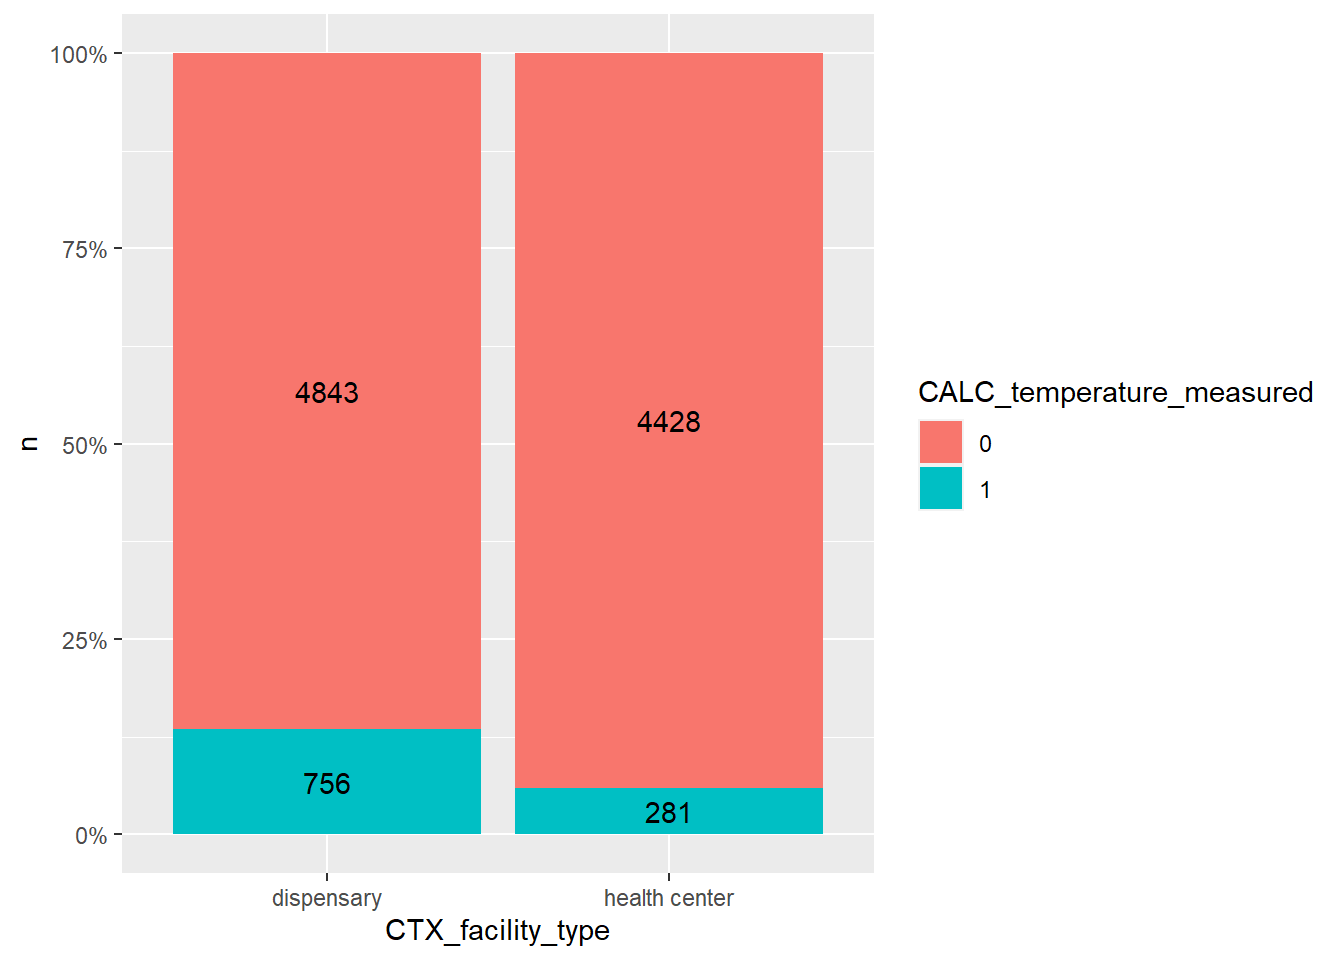
| CALC_temperature_measured | ||
| 0 | 4,843 (86%) | 4,428 (94%) |
| 1 | 756 (14%) | 281 (6.0%) |
| CALC_fever_measured | ||
| 0 | 507 (67%) | 204 (73%) |
| 1 | 249 (33%) | 77 (27%) |
| (Missing) | 4,843 | 4,428 |
| CALC_fever_all | ||
| 0 | 1,699 (30%) | 1,357 (29%) |
| 1 | 3,900 (70%) | 3,352 (71%) |
| TEST_malaria_done | ||
| 0 | 2,589 (46%) | 1,956 (42%) |
| 1 | 3,010 (54%) | 2,753 (58%) |
| TEST_malaria_type | ||
| 1 | 2,836 (94%) | 2,535 (92%) |
| 2 | 134 (4.5%) | 206 (7.5%) |
| 95 | 1 (<0.1%) | 1 (<0.1%) |
| 98 | 34 (1.1%) | 11 (0.4%) |
| (Missing) | 2,594 | 1,956 |
| TEST_malaria_result | ||
| 0 | 2,414 (80%) | 2,251 (82%) |
| 1 | 544 (18%) | 488 (18%) |
| 2 | 0 (0%) | 1 (<0.1%) |
| 95 | 2 (<0.1%) | 1 (<0.1%) |
| 98 | 45 (1.5%) | 12 (0.4%) |
| (Missing) | 2,594 | 1,956 |
| DX_severe | ||
| 0 | 5,540 (99%) | 4,514 (96%) |
| 1 | 59 (1.1%) | 195 (4.1%) |
| DX_malaria | ||
| 0 | 4,405 (79%) | 4,103 (87%) |
| 1 | 1,194 (21%) | 606 (13%) |
| DX_malaria_severe | ||
| 0 | 5,579 (100%) | 4,581 (97%) |
| 1 | 20 (0.4%) | 128 (2.7%) |
| RX_antimalarials | ||
| 0 | 4,923 (88%) | 4,095 (87%) |
| 1 | 676 (12%) | 614 (13%) |
| RX_antimalarial_parenteral | ||
| 0 | 5,562 (99%) | 4,497 (95%) |
| 1 | 37 (0.7%) | 212 (4.5%) |
| RX_antibiotics | ||
| 0 | 2,407 (43%) | 2,471 (52%) |
| 1 | 3,192 (57%) | 2,238 (48%) |
| MGMT_referral_src_caregiver | ||
| 0 | 5,528 (99%) | 4,594 (98%) |
| 1 | 60 (1.1%) | 104 (2.2%) |
| 97 | 6 (0.1%) | 3 (<0.1%) |
| 98 | 5 (<0.1%) | 8 (0.2%) |
| MGMT_referral_src_registry | ||
| 0 | 5,578 (100%) | 4,616 (98%) |
| 1 | 21 (0.4%) | 93 (2.0%) |
| 1 n (%) | ||
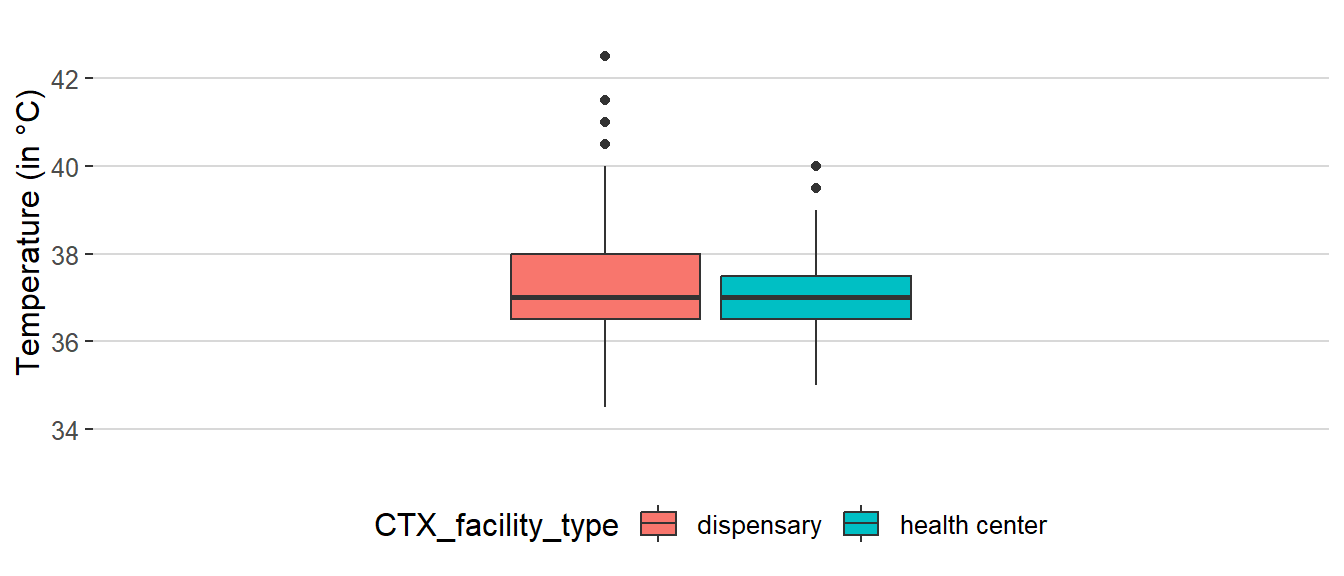
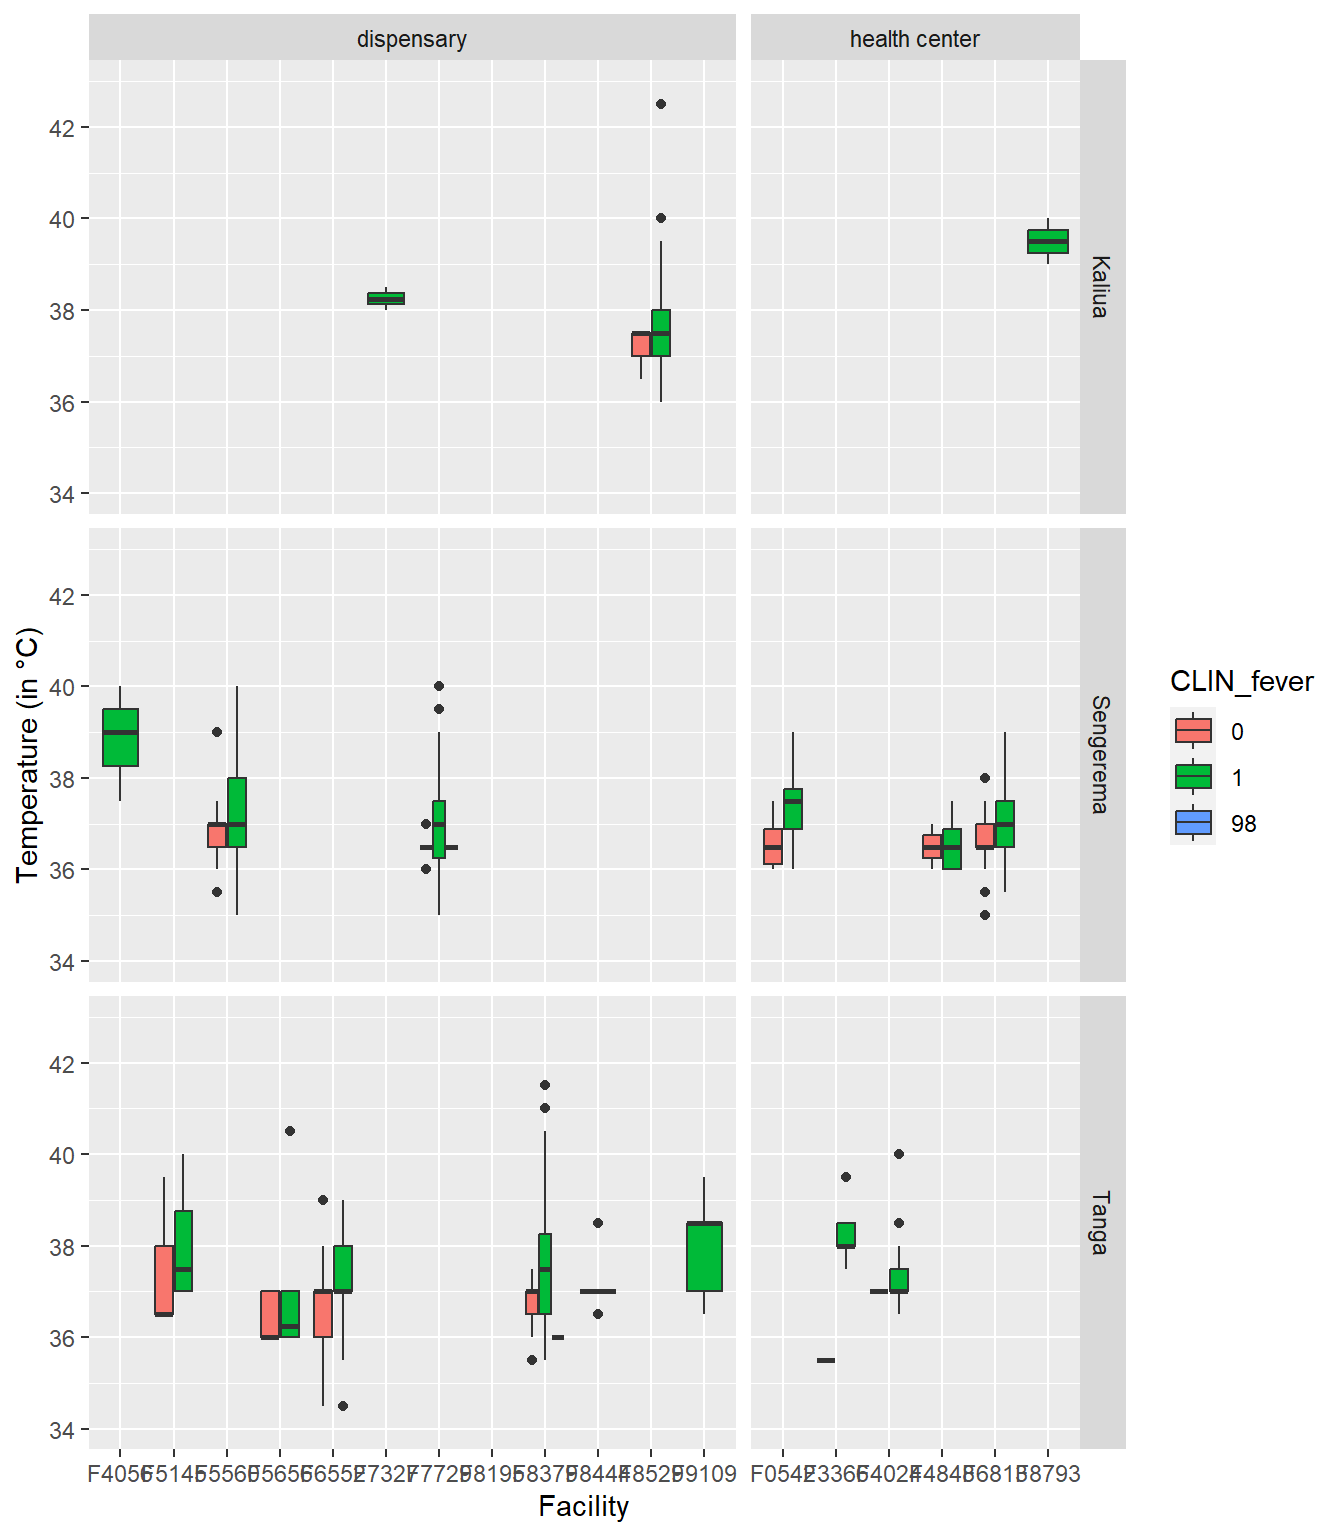
21.4.1 Temperature measurement
Distribution of temperature measurements and associated factors
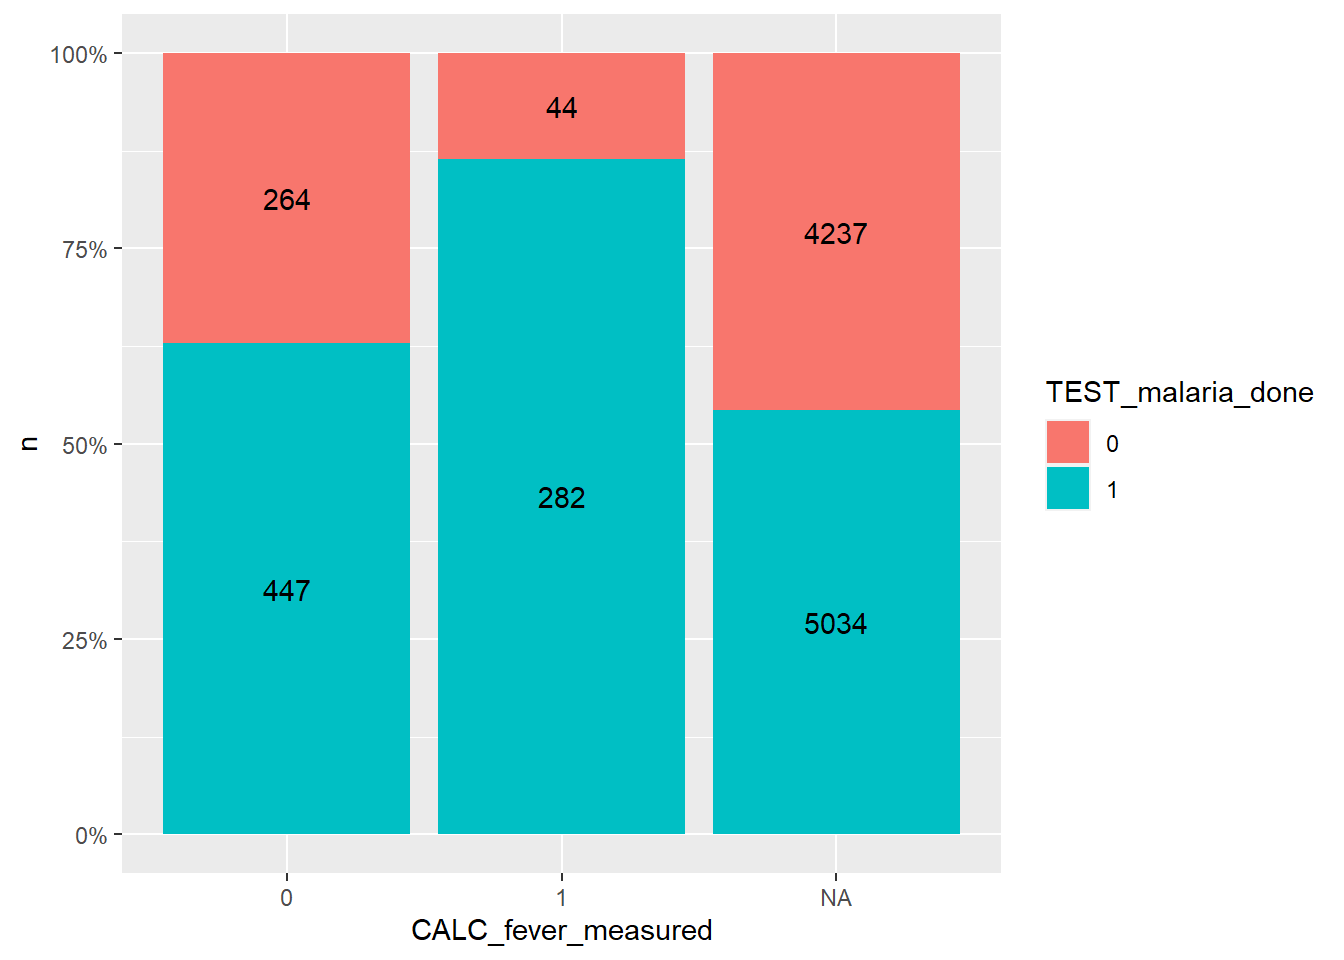
21.4.2 Fever assessment
Distribution of measured fever
| Missing data analysis: MEAS_temperature | Not missing | Missing | p | |
|---|---|---|---|---|
| SDC_age_category | <2 months | 56 (9.4) | 541 (90.6) | 0.108 |
| 02-11 months | 338 (9.5) | 3238 (90.5) | ||
| 12-23 months | 293 (9.9) | 2654 (90.1) | ||
| 24-35 months | 181 (11.8) | 1348 (88.2) | ||
| 36-47 months | 108 (11.0) | 872 (89.0) | ||
| 48-59 months | 61 (9.0) | 618 (91.0) | ||
| CTX_district | Kaliua | 61 (2.5) | 2368 (97.5) | <0.001 |
| Sengerema | 573 (21.2) | 2130 (78.8) | ||
| Tanga | 403 (7.8) | 4773 (92.2) | ||
| CTX_area | rural | 454 (11.1) | 3634 (88.9) | 0.005 |
| urban | 583 (9.4) | 5637 (90.6) | ||
| CTX_facility_type | dispensary | 756 (13.5) | 4843 (86.5) | <0.001 |
| health center | 281 (6.0) | 4428 (94.0) | ||
| CLIN_fever | 0 | 238 (7.8) | 2830 (92.2) | <0.001 |
| 1 | 796 (11.0) | 6429 (89.0) | ||
| 98 | 3 (20.0) | 12 (80.0) |
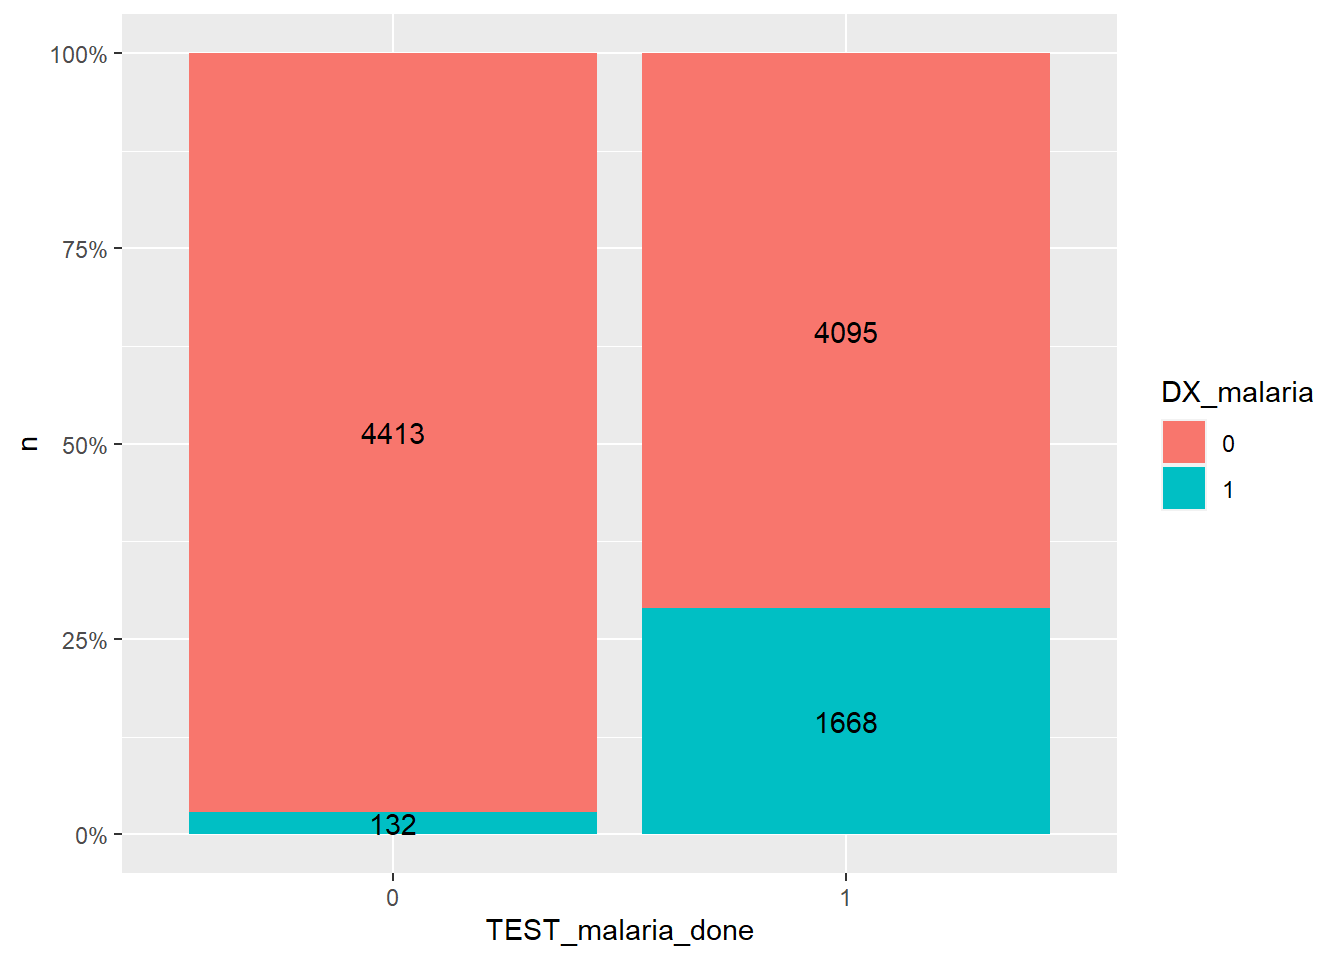
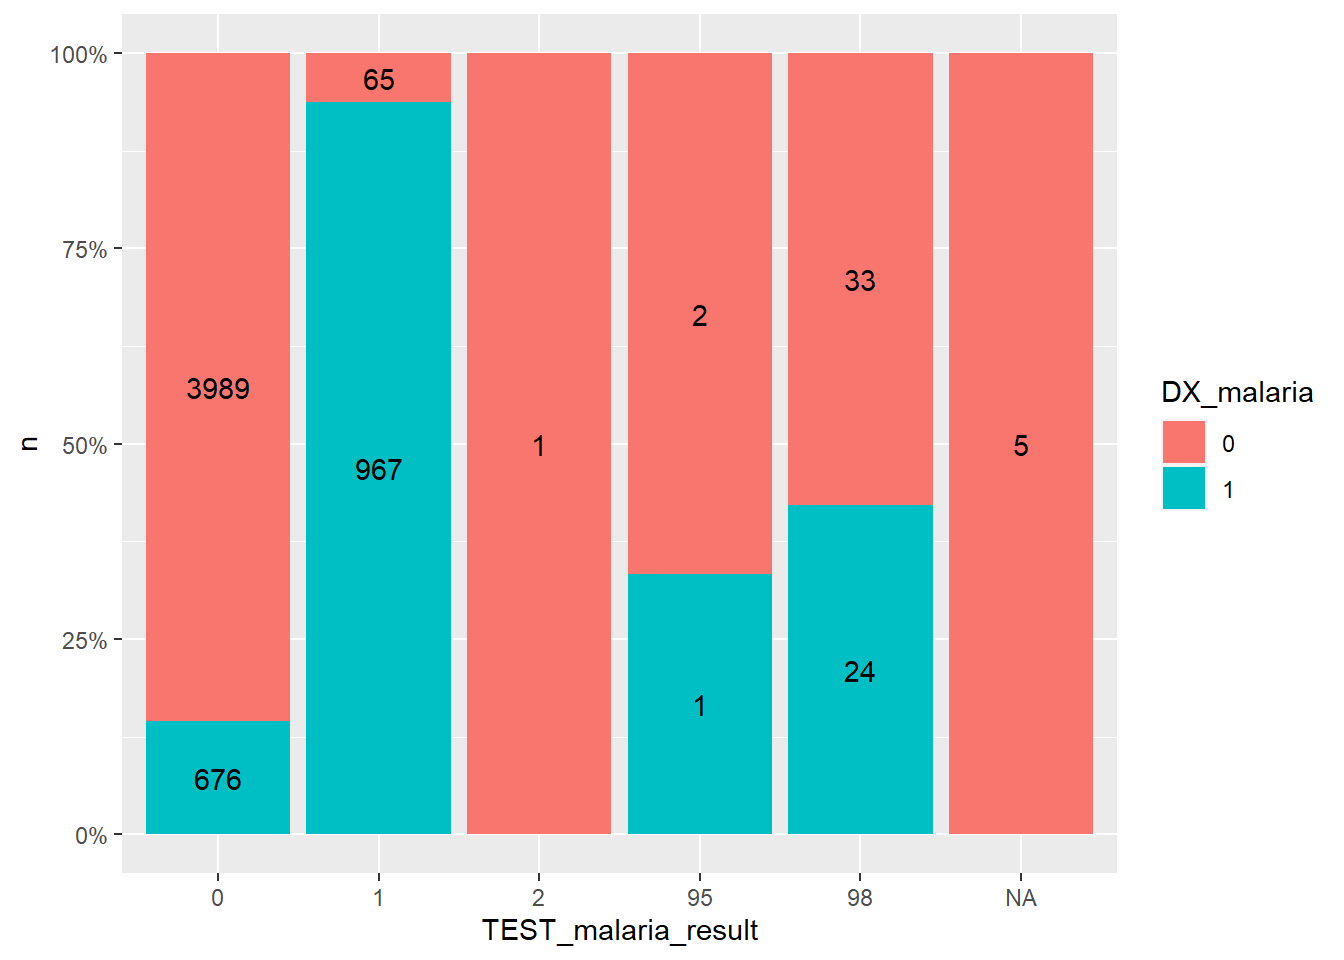
21.4.3 Malaria tests
| 0 | 1 | |
|---|---|---|
| 0 | 264 | 447 |
| 1 | 44 | 282 |
21.4.4 Malaria diagnoses
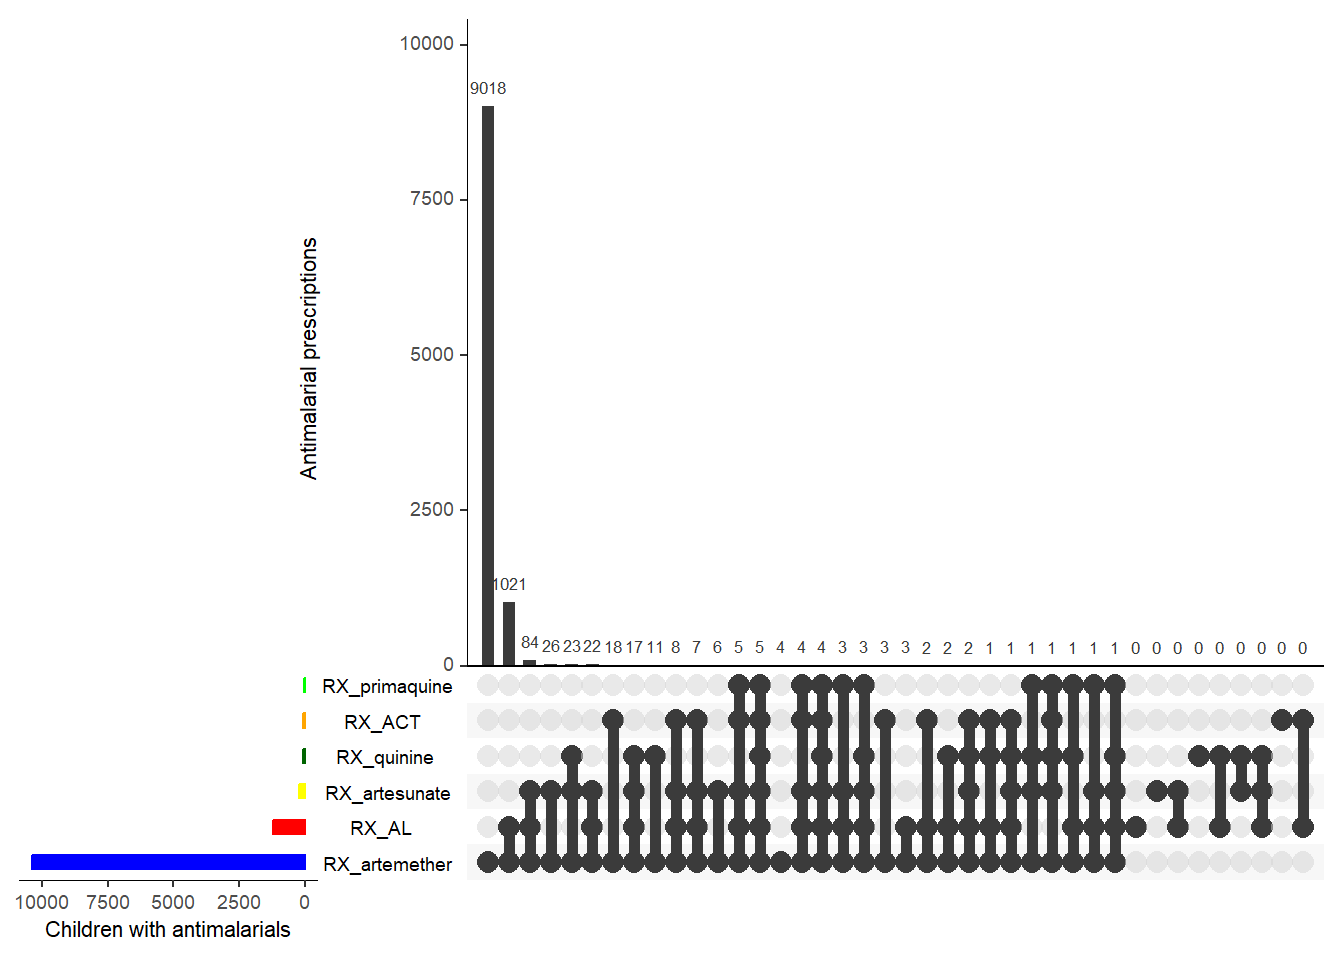
21.4.5 Malaria treatments
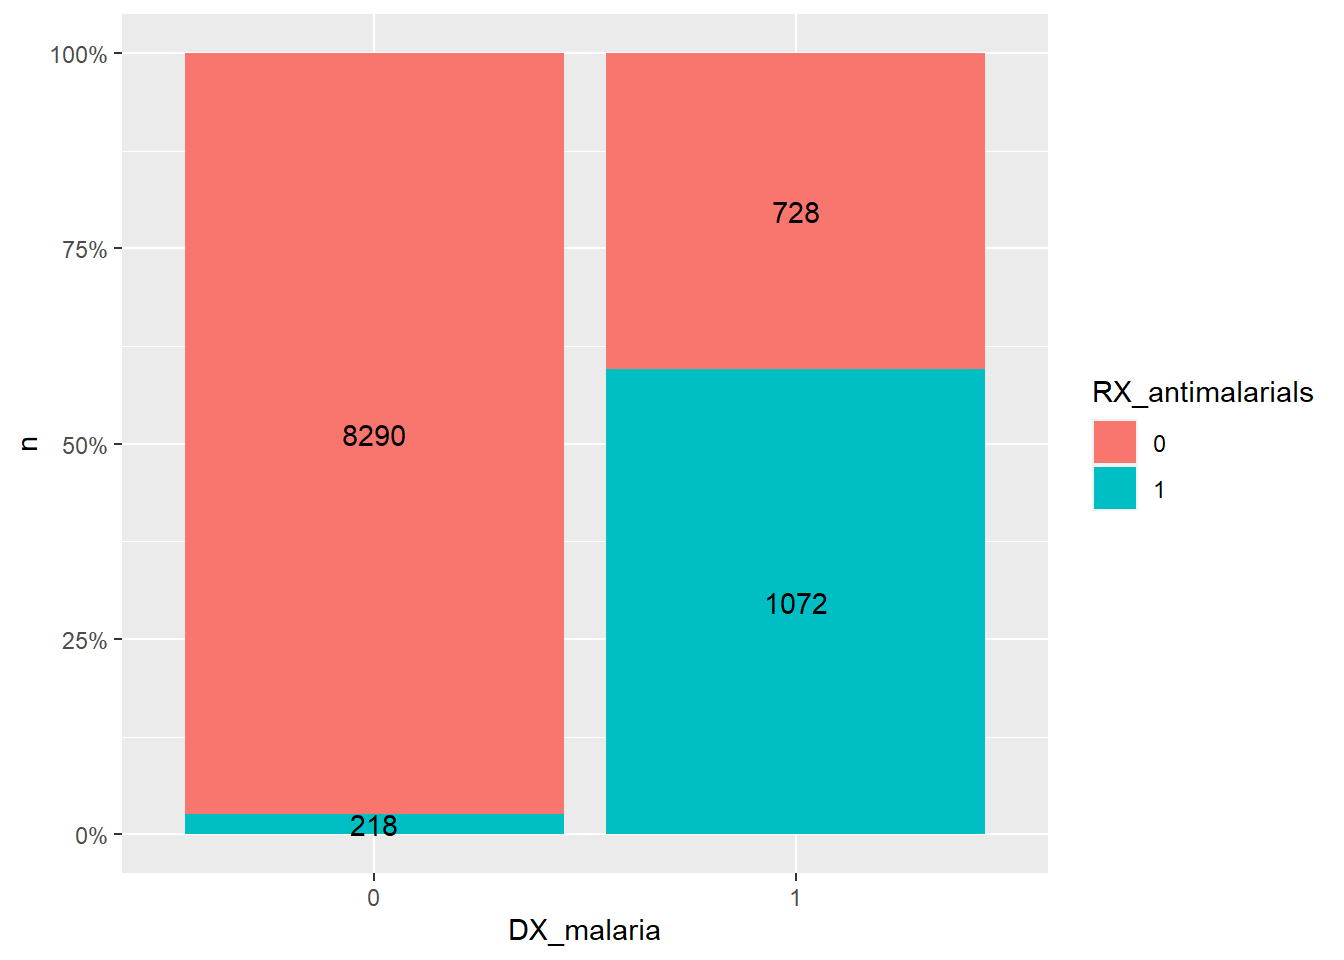

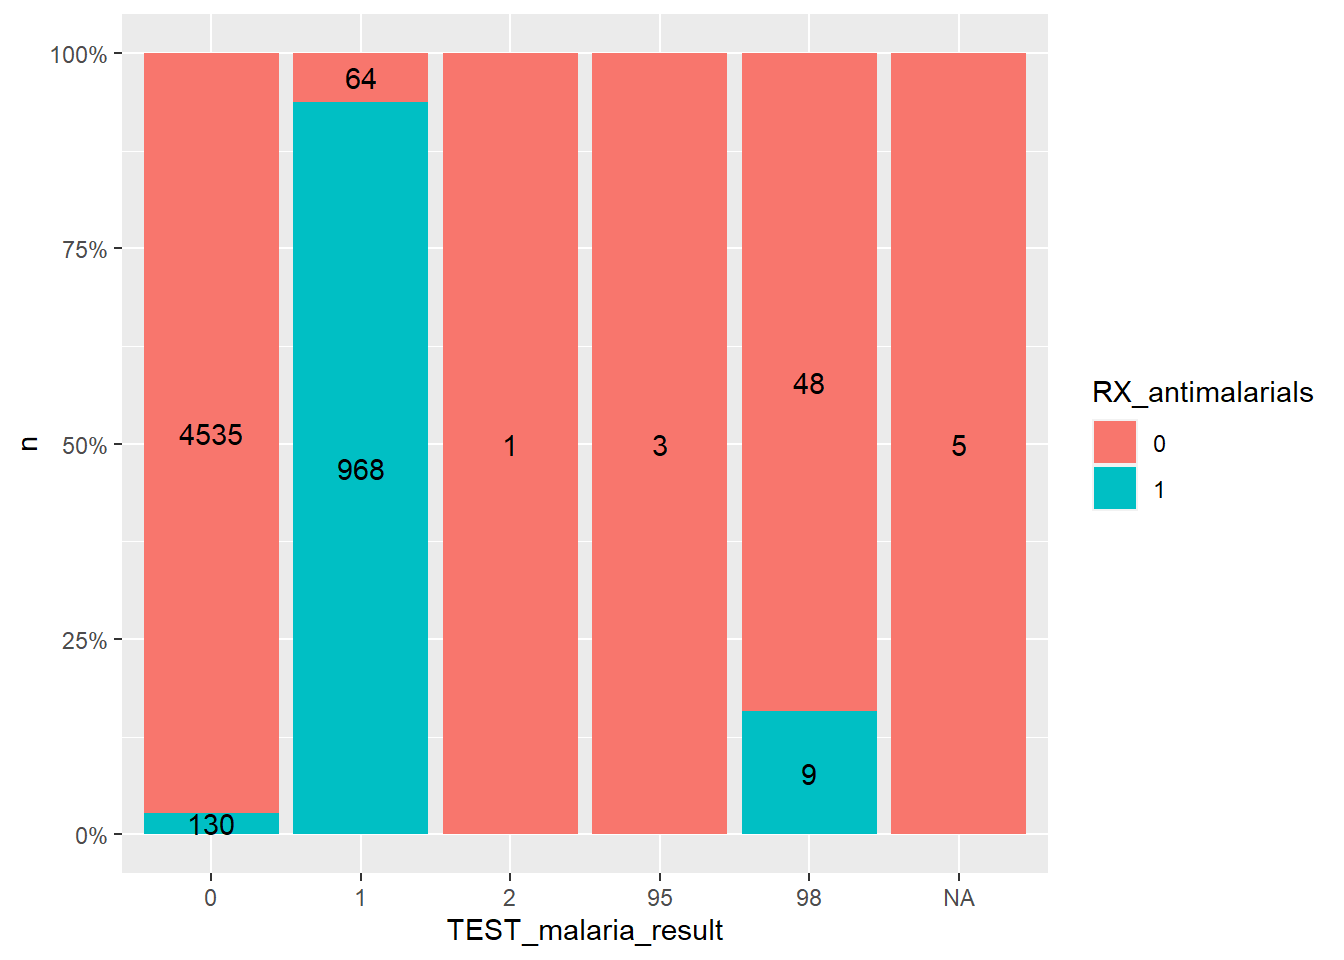
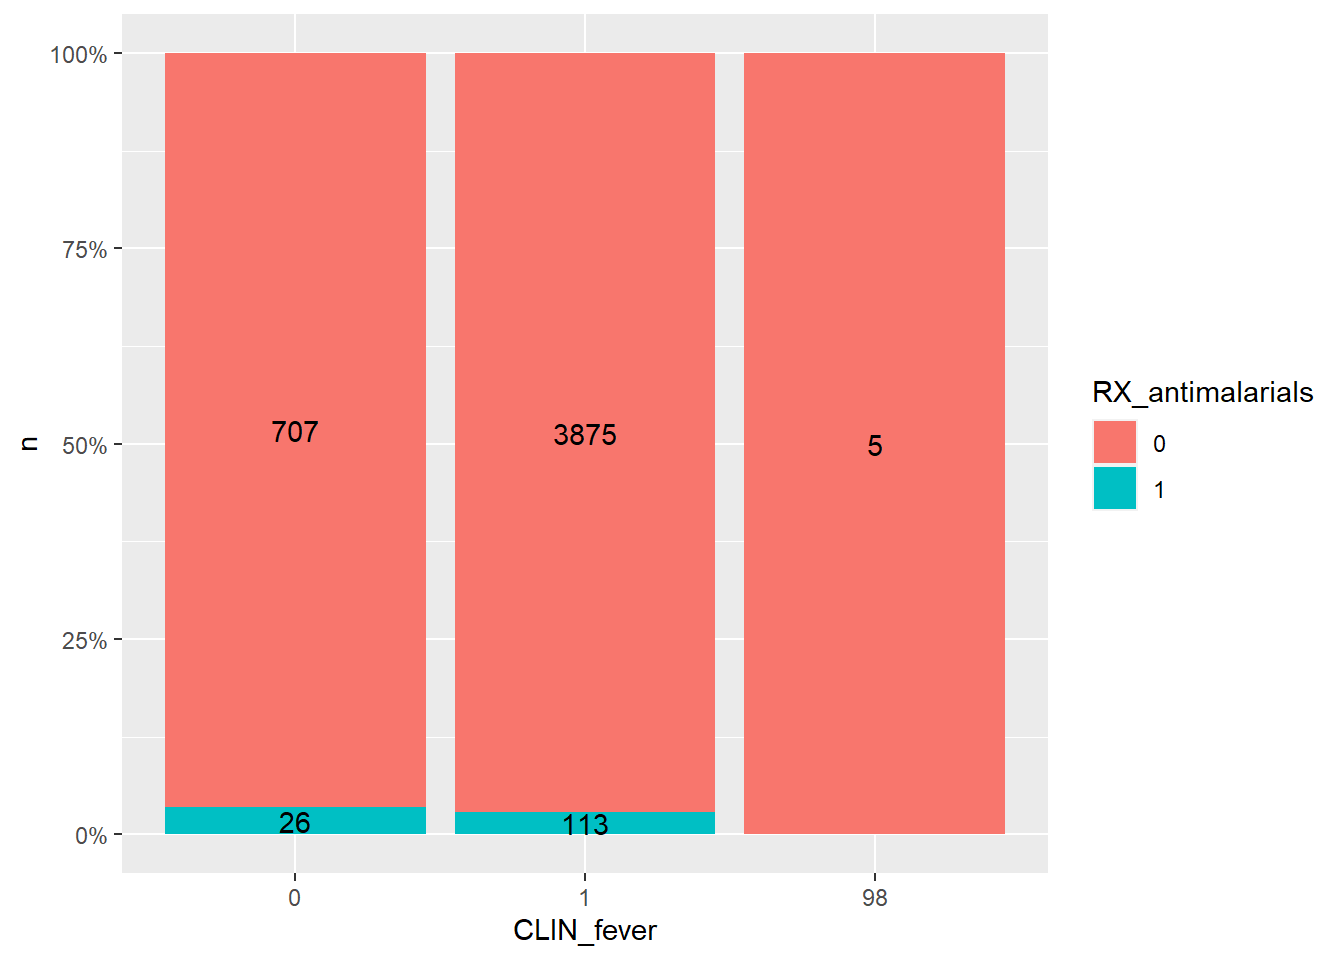
| Result | Diagnosis | Antimalarials | Freq |
|---|---|---|---|
| 0 | 0 | 0 | 3890 |
| 1 | 0 | 0 | 15 |
| 2 | 0 | 0 | 1 |
| 95 | 0 | 0 | 2 |
| 98 | 0 | 0 | 31 |
| 0 | 1 | 0 | 645 |
| 1 | 1 | 0 | 49 |
| 2 | 1 | 0 | 0 |
| 95 | 1 | 0 | 1 |
| 98 | 1 | 0 | 17 |
| 0 | 0 | 1 | 99 |
| 1 | 0 | 1 | 50 |
| 2 | 0 | 1 | 0 |
| 95 | 0 | 1 | 0 |
| 98 | 0 | 1 | 2 |
| 0 | 1 | 1 | 31 |
| 1 | 1 | 1 | 918 |
| 2 | 1 | 1 | 0 |
| 95 | 1 | 1 | 0 |
| 98 | 1 | 1 | 7 |
21.4.5.1 Combination of treatments